Abstract:
The effects of nano-magnesium hydroxide and common magnesium hydroxide (100, 200, and 300 mg·kg-1) on the forms of cadmium in different types of cadmium contaminated soils (1, 5, 10, and 15 mg·kg-1) were studied under 28 days of continuous culture experiment. In the neutral soil, during the 28 days of culture, soil exchange Cd (EX-Cd) form distribution ratio (FDC) decreased at first and then increased with the culture time increasing under treatment of 1, 5, 10, and 15 mg·kg-1 Cd. The minima of soil EX-Cd FDC were found on the 14th day under 1 mg·kg-1 Cd and 5 mg·kg-1 Cd treatments, whereas the minima of soil EX-Cd FDC were observed on the 4th day under 10 mg·kg-1 Cd and 15 mg·kg-1 Cd treatments. The FDC of soil carbonate bound Cd (CAB-Cd), iron manganese oxidized Cd (FeMn-Cd), and organic bound Cd (OM-Cd) increased at first, then decreased, and finally, became stable, and the maxima of soil CAB-Cd, FeMn-Cd, and OM-Cd FDC were found on the 4th day, whereas the minima of soil CAB-Cd, FeMn-Cd, and OM-Cd FDC were observed on the 14th day. Soil residual Cd (RES-Cd) FDC increased gradually and then tended to becomes stable during the 28 days of culture. The soil EX-Cd FDC was 66.7%-81.8% at 1, 5, 10, and 15 mg·kg-1 Cd treatments, which was the main form of the soil. The FDC of soil Cd forms was in the order of EX-Cd > CAB-Cd > RES-Cd > FeMn-Cd > OM-Cd. Soil EX-Cd FDC reached the lowest value on the 14th Day. Soil EX-Cd FDC was reduced by nano-magnesium hydroxide and common magnesium hydroxide, and it decreased with the increase of the amount of magnesium hydroxide. During 0-28 days of culture, the soil EX-Cd FDC decreased by 11.4%-67.7%, 7.8%-37.2%, 7.7%-36.4%, 5.0%-28.8% (nano-magnesium hydroxide) and 0.5%-49.5%, 0.6%-15.0%, 1.0%-18.1%, 0.7%-14.6% (ordinary magnesium hydroxide) at 1, 5, 10, and 15 mg·kg-1 Cd treatments, respectively. The EX-Cd content of alkaline soil reached the lowest value on the 7th day of culture, and the EX-Cd content of acidic soil reached the lowest value on the 21st day under 1, 5, and 10 mg·kg-1 Cd treatments. The content of EX-Cd in neutral, acidic, and alkaline soils decreased with the increase of magnesium hydroxide content, and the content of EX-Cd in soil decreased with the increase of magnesium hydroxide amount. At the same amount, the effect of passivating soil EX-Cd under nanometer magnesium hydroxide treatment was superior to ordinary magnesium hydroxide treatment.
Cadmium (Cd) is a highly toxic element that has no biological function for humans or plants [1]. The increased accumulation of cadmium in soil caused by human activities will lead to the accumulation of cadmium in crops, threatening the health of humans, animals and plants through the food chain. Health. At present, about 10 million hm2 of cultivated land in China is polluted, and about 12 million tons of food crops are lost every year due to soil heavy metal pollution [2]. It is considered to fix heavy metals in contaminated soil in situ by adding exogenous active amendments It is a simple and low-cost remediation measure for contaminated soil [3]. In heavy metal contaminated soil, the application of some immobilized amendments such as limestone, zeolite, phosphate and organic materials, as well as nano-bioremediation materials and their composite materials can Reduce the effective components of heavy metals or change their redox state, thereby effectively reducing the mobility and bioavailability of heavy metals in soil [4]. Therefore, the in-situ passivation remediation method of heavy metal pollution in soil has attracted the attention of researchers [5 ]. Traditional passivators themselves may contain certain heavy metal elements, which can easily cause secondary pollution sources [6]. In recent years, environmentally friendly and efficient heavy metal passivators, such as modified biochar, nano-zeolite and nano-hydroxyphosphorus Limestone has been reported as an in-situ passivation repair material for heavy metals in soil [7]. Nano-magnesium hydroxide is a new type of magnesium hydroxide with a particle size between 1 and 100nm. It can not only increase the input of magnesium, an essential element for plants [8 , 9], and it has a large adsorption capacity for heavy metals. Liu Yu et al. [10] found in the study that after applying nano-magnesium hydroxide, the Cd content of Chinese cabbage leaves, petioles and roots decreased by 5.3% to 19.2% and 9.0, respectively. %~28.1% and 3.5%~19.3%, the soil Cd content decreased by 8.2%~41.5%. At the same application rate, the Cd content of Chinese cabbage leaves, petioles and roots treated with nano-magnesium hydroxide was significantly lower than that treated with ordinary magnesium hydroxide. Although nano-magnesium hydroxide has been reported in the fields of environmental protection and fertilizers, there are few domestic and foreign research reports on its application in the remediation of soil heavy metal pollution [11, 12], and the remediation mechanism of nano-magnesium hydroxide on soil cadmium pollution is also unclear. still not clear.
1 Materials and methods
1.1 Test materials
The neutral soil was collected from the purple soil base of Southwest University in Beibei District, Chongqing (E106°24′50.66″, N29°48′30.58″). The basic physical and chemical properties of the soil were total nitrogen 0.77 g·kg-1, alkaline nitrogen 53.33 mg·kg-1, total phosphorus 0.55 g·kg-1, available phosphorus 17.07 mg·kg-1, total potassium 21.31 g·kg-1, effective potassium 84.81 mg·kg-1, organic matter 13.88 g·kg-1, pH 6.80, CEC(+) 30.70 cmol·kg-1, total Cd 0.24 mg·kg-1, No effective Cd was detected.
The alkaline soil for the test was collected from Xiaozhou Village, Tongnan County, Chongqing (E105°05′54.44″, N30°14′18.97″). The basic physical and chemical properties of the soil were total nitrogen 0.77 g·kg-1, alkaline nitrogen 34.16 mg·kg-1, total phosphorus 1.16 g·kg-1, available phosphorus 25.78 mg·kg-1, total potassium 16.93 g·kg-1, available potassium 46.28 mg·kg-1, organic matter 10.33 g·kg-1, pH 8.16, CEC(+) 14.34 cmol·kg-1, total Cd 0.324 mg·kg-1, and no effective Cd was detected.
The acidic soil for the test was collected from Yuxi Vegetable Research and Development Center, Xiguan Village, Bishan District, Chongqing (E106°17′57.83″, N29°47′43.83″), the basic physical and chemical properties of the soil are total nitrogen 1.05 g·kg-1, alkaline nitrogen 87.05 mg·kg-1, total phosphorus 0.46 g·kg-1, available phosphorus 45.19 mg·kg-1, total potassium 17.98 g·kg-1, effective potassium 167.15 mg·kg-1, organic matter 19.38 g·kg-1, pH 4.70, CEC(+) 25.50 cmol·kg-1, total Cd 0.21 mg·kg-1, no effective Cd was detected.
The particle size range of the tested nanomagnesium hydroxide (nMg) is 82~127 nm, provided by Zhengzhou University.
1.2 Experimental design
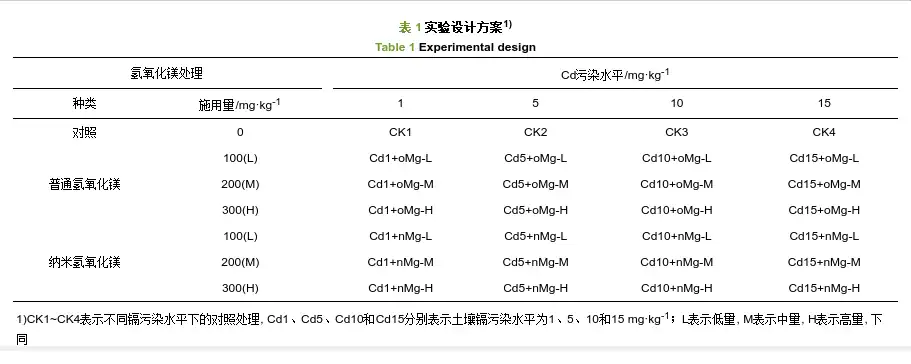
This experiment was conducted in the 713 laboratory of the School of Resources and Environment, Southwest University, Chongqing from February 13, 2017 to March 27, 2017. Neutral, acidic and alkaline soils (soil pH was 6.80, 4.70 and 8.16, respectively) were collected, and four soil Cd2+ pollution levels (1, 5, 10 and 15 mg·kg-1) and four application rates of nano magnesium hydroxide (nMg) and ordinary magnesium hydroxide (oMg) (0, 100, 200 and 300 mg·kg-1, Table 1) were set, with three replicates for each treatment. The indoor continuous culture experiment was carried out using the method of Xiong Shijuan [3].
1.3 Determination methods
1.3.1 Determination of basic soil properties
Basic physical and chemical indicators such as soil pH, soil cation exchange capacity, soil total nitrogen, soil alkaline nitrogen, soil available phosphorus, soil available potassium and soil organic matter were determined by the method of Yang Jianhong et al. [13].
1.3.2 Determination of soil available Cd, total Cd content and soil Cd form classification
The soil available Cd was determined by DTPA extraction (GB/T 23739-2009) [14], and the soil Cd form classification was determined by the five-step continuous extraction method of Tessier et al. [15]. The extract was determined by atomic absorption spectrophotometry (Perkin Elmer SIMMA 6000, Norwalk, USA).
1.4 Data processing and statistical analysis
The data were statistically analyzed using SPSS 19.0, Fisher least significant difference (LSD) and Pearson correlation coefficient method.
2 Results and analysis
2.1 Changes in soil Cd forms under different Cd levels
As shown in Figures 1-4, in the neutral soil, during the 28-day incubation process, the main forms of soil Cd under different Cd treatments and the trend of Cd FDC with incubation time were different. Under the 1 mg·kg-1 Cd treatment, EX-Cd existed mainly on the 0th to 1st day of incubation, with an FDC of 43.5%-66.7%; on the 4th day, the EX-Cd FDC decreased, with CAB-Cd and RES-Cd as the main forms; from the 4th day of incubation to the end of incubation, RES-Cd was the main form of Cd in all treatments, and the FDC on the 7th, 14th, 21st and 28th days were 31.0%-37.6%, 40.0%-51.8%, 40.2%-46.8% and 36.2%-42.1%, respectively. Under the 5, 10 and 15 mg·kg-1 Cd treatments, In all treatments, EX-Cd was the main form during the 28 days of cultivation, and its FDC was 23.6%-73.7%, 26.6%-77.4% and 35.5%-81.1%, respectively. During the cultivation process, the FDC of different forms of cadmium showed different trends under different cadmium levels. Under the treatments of 1, 5, 10 and 15 mg·kg-1 cadmium, the soil EX-Cd FDC showed a trend of first decreasing, then increasing and then stabilizing with the extension of cultivation time. Under the treatments of 1 mg·kg-1 and 5 mg·kg-1 cadmium, it gradually decreased from 0 to 14 days and reached the minimum value on the 14th day. At this time, the EX-Cd FDC decreased by 73.7%-91.5% and 48.9%-67.9% compared with the 0th day, respectively. It showed an increasing trend from 14 to 21 days and stabilized from 21 to 28 days; under the treatments of 10 mg·kg-1 and 15 mg·kg-1 cadmium, it increased from 0 to 4 days and stabilized from 21 to 28 days. The FDCs of CAB-Cd, FeMn-Cd and OM-Cd in the culture process showed the same trend under different cadmium levels. The FDC of CAB-Cd increased gradually from 0 to 4 days, reached the maximum on 4 days, decreased gradually from 4 to 14 days, reached the minimum on 14 days, and showed an increasing trend from 14 to 21 days, and tended to be stable from 21 to 28 days. The FDCs of FeMn-Cd and OM-Cd in the culture process showed the same trend under different cadmium levels. The FDC of CAB-Cd increased gradually from 0 to 4 days, reached the maximum on 4 days, decreased gradually from 4 to 14 days, reached the minimum on 14 days, showed an increasing trend from 14 to 21 days, and tended to be stable from 21 to 28 days under 1, 5, 10 and 15 mg·kg-1 cadmium treatments, and showed the maximum on 14 days. It showed a downward trend from the 14th to the 21st day and tended to be stable from the 21st to the 28th day. The changing trends of RES-Cd FDC during the cultivation process under different cadmium levels were slightly different. Under the 1 mg·kg-1 cadmium treatment, RES-Cd FDC gradually increased from the 0th to the 14th day and tended to be stable from the 14th to the 28th day; under the 5 mg·kg-1 cadmium treatment, RES-Cd FDC gradually increased from the 0th to the 7th day and tended to be stable from the 7th to the 28th day; under the 10 mg·kg-1 and 15 mg·kg-1 cadmium treatments, the RES-Cd FDC change trend was consistent, first increasing, then decreasing and then tending to be stable with the extension of the cultivation time, reaching the maximum on the 4th day and reaching a stable trend from the 14th to the 28th day.
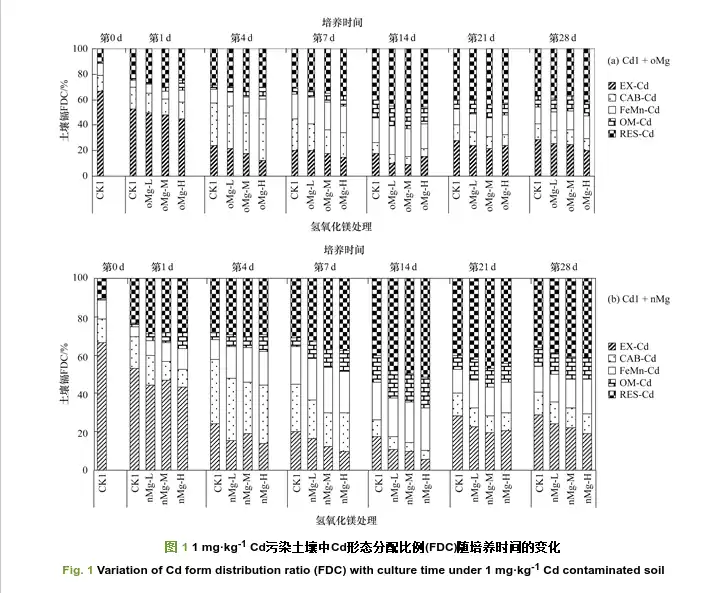
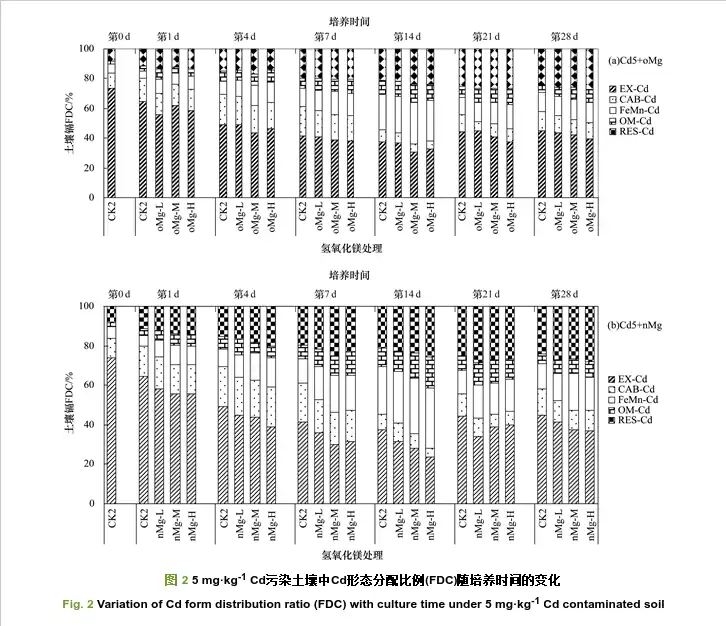
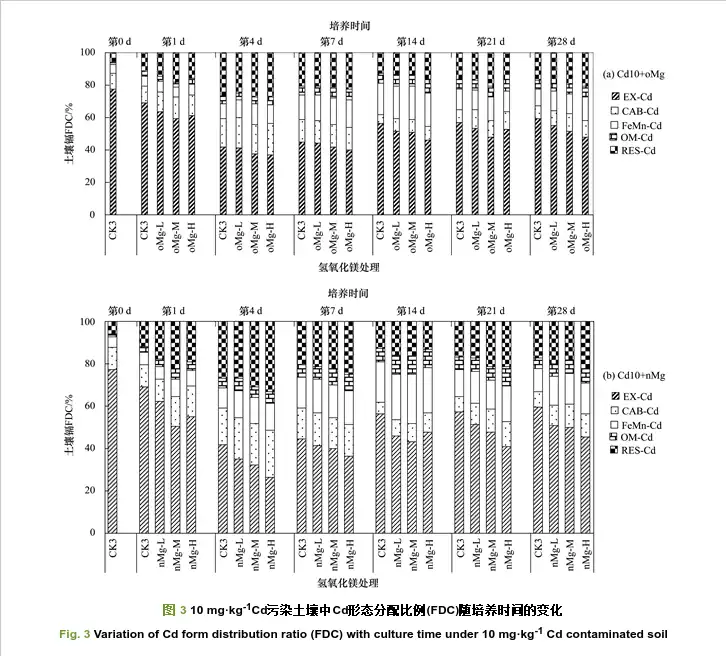
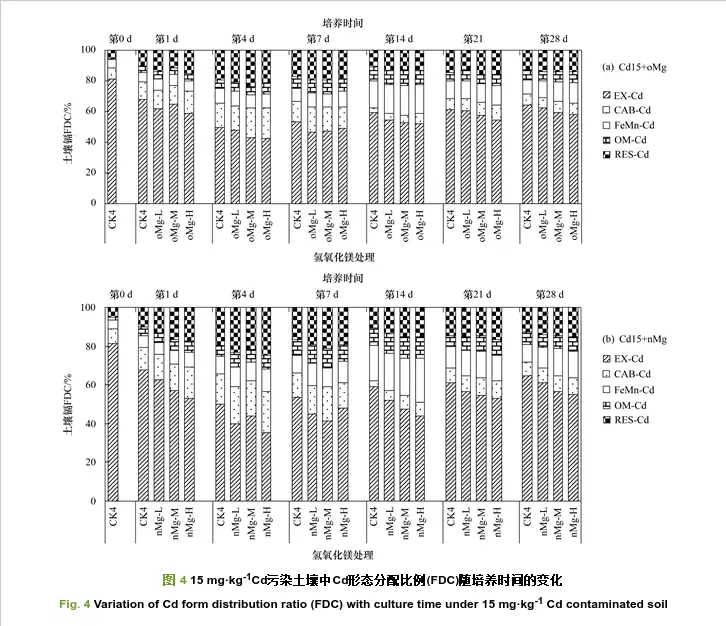
At the end of the 3-week cadmium aging, that is, on the 0th day of cultivation, the soil under each cadmium level treatment mainly existed in the form of EX-Cd. Under the 1, 5, 10 and 15 mg·kg-1 cadmium treatments, the soil EX-Cd The FDCs of soil Cd and OM-Cd were 66.7%, 73.7%, 77.4% and 81.8%, respectively, which were significantly higher than those of other forms (P < 0.05). The FDC of OM-Cd was only 0.9%~1.9%, and they all showed EX-Cd >CAB-Cd >RES-Cd >FeMn-Cd >OM-Cd. On the first day of cultivation, compared with the 0th day, the soil EX-Cd under 1, 5, 10 and 15 mg·kg-1 Cd treatments increased significantly. FDC decreased by 26.1%-34.8%, 12.3%-24.7%, 10.7%-29.0% and 16.4%-34.4% respectively; soil OM-Cd increased by 89.1%-855.9%, 73.0%-246.4%, 153.4%-314.5% and 279.4%-422.5% respectively; soil RES-Cd increased by 118.4%-184.7%, 35.8%-69.5%, 91.9%-268.2% and 95.0%-229.8% respectively. On the first day of cultivation, the FDC of each form of cadmium under each cadmium level had a different order, but EX-Cd FDC was the largest, OM-Cd FDC was the smallest, and RES-Cd FDC was the highest under 1 mg·kg-1 cadmium treatment. On the fourth day of cultivation, soil EX-Cd FDC dropped sharply. Compared with the first day, Under the 1, 5, 10 and 15 mg·kg-1 Cd treatments, soil EX-Cd FDC decreased by 54.6%~73.1%, 12.1%~30.4%, 35.0%~51.7% and 23.1%~36.4%, respectively; soil CAB-Cd, FeMn-Cd and RES-Cd FDC increased by 17.1%~222.4%, 13.5%~118.2% and 1.3%~127.6% under each Cd level compared with the 0th day. On the 7th day of cultivation, soil EX-Cd FDC continued to decrease under the 1 mg·kg-1 and 5 mg·kg-1 Cd treatments, but slightly rebounded under the 10 mg·kg-1 and 15 mg·kg-1 Cd treatments, which was exactly the opposite of the change in RES-Cd FDC; CAB-Cd showed a decreasing trend under each Cd level, while OM-Cd FDC showed an increasing trend; FeMn-Cd FDC continued to increase under 1, 5 and 10 mg·kg-1 cadmium treatments, but the FeMn-Cd FDC of soil did not change significantly under 15 mg·kg-1 cadmium treatment. On the 14th day of cultivation, the EX-Cd FDC of soil under 1 and 5 mg·kg-1 cadmium treatments reached the lowest level during the entire cultivation process, among which the EX-Cd FDC under 1 mg·kg-1 cadmium treatment was only 5.7%~17.6%, and the EX-Cd FDC of soil under 10 and 15 mg·kg-1 cadmium treatments increased slightly, but began to stabilize; the CAB-Cd FDC under each cadmium level reached the lowest level on the 14th day, and the CAB-Cd FDC of soil under 1, 5, 10 and 15 mg·kg-1 cadmium treatments were 4.3%~9.0%, 4.6%~9.2%, 5.5%~8.9% and 3.1%~7.0%, respectively; in contrast to the changes in CAB-Cd FDC, The FeMn-Cd and OM-Cd FDCs at each cadmium level reached their maximum values on the 14th day, which were 19.0%~22.2% and 13.3%~16.0% (1 mg·kg-1), 24.0%~30.5% and 9.5%~15.7% (5 mg·kg-1), 19.4%~23.4% and 6.0%~9.1% (10 mg·kg-1), and 17.8%~22.9% and 9.3%~11.1% (15 mg·kg-1), respectively. The FDCs of cadmium forms in each treatment at each cadmium level tended to be stable from the 21st to the 28th day of incubation, with no obvious changes. At the end of incubation, with the increase of cadmium level, soil EX-Cd FDC gradually increased among the treatments, while RES-Cd FDC showed the opposite trend, decreasing among the treatments. On the 28th day of incubation, the soil FDC of RES-Cd increased gradually among the treatments, and the soil FDC of RES-Cd decreased gradually among the treatments. The FDC order of each cadmium form under each cadmium level was slightly different at d. Under the 1 mg·kg-1 cadmium treatment, the cadmium form distribution was roughly RES-Cd (36.2%~41.2%)>EX-Cd (19.2%~29.0%)>FeMn-Cd (13.0%~18.4%)>CAB-Cd (9.6%~12.0%)>OM-Cd (9.8%~11.8%); under the 5 mg·kg-1 cadmium treatment, it was EX-Cd (37.2%~44.6%)>RES-Cd (24.2%~27.9%)>FeMn-Cd (12.9%~18.9%)>CAB-Cd (10.0%~13.3%)>OM-Cd (5.0%~8.3%); under the 10 Under the treatment of 15 mg·kg-1 cadmium, it showed EX-Cd (45.6%~59.3%)>RES-Cd (17.2%~22.1%)>FeMn-Cd (10.8%~14.6%)>CAB-Cd (7.7%~11.3%)>OM-Cd (5.0%~7.1%); under the treatment of 15 mg·kg-1 cadmium, it showed EX-Cd (55.2%~64.5%)>RES-Cd (12.7%~15.2%)>FeMn-Cd (9.1%~13.8%)>CAB-Cd (6.4%~8.3%)>OM-Cd (6.4%~7.5%).
The addition of nMg and oMg and the amount of magnesium hydroxide added had a complex effect on the changes in the FDC of each form of cadmium under each cadmium level, and did not show a consistent pattern, but from the perspective of the entire culture process, The addition of magnesium hydroxide reduced the EX-Cd FDC under each cadmium level, reduced the soil CAB-Cd FDC under 1 mg·kg-1 and 5 mg·kg-1 cadmium treatments, increased the soil CAB-Cd FDC under 10 mg·kg-1 and 15 mg·kg-1 cadmium treatments, and increased the FeMn-Cd, OM-Cd and RES-Cd FDC under each cadmium level. During the 0-28th day of incubation, compared with the treatment without magnesium hydroxide, the nMg and oMg treatments had a significant effect on the soil EX-Cd under 1, 5, 10 and 15 mg·kg-1 cadmium treatments. The FDC decreased by 11.4%~67.7%, 7.8%~37.2%, 7.7%~36.4%, 5.0%~28.8% (nMg) and 0.5%~49.5%, 0.6%~15.0%, 1.0%~18.1%, 0.7%~14.6% (oMg), respectively. The type of magnesium hydroxide had no obvious change pattern on the FDC of the other four forms of cadmium, but the addition of magnesium hydroxide still had an effect on the distribution ratio of the four forms of cadmium. During the cultivation process, compared with the treatment without magnesium hydroxide, the addition of magnesium hydroxide reduced the soil CAB-Cd FDC by 2.0%~51.7% and 1.3%~43.5% under the treatment of 1 mg·kg-1 and 5 mg·kg-1 cadmium, and increased the soil CAB-Cd FDC under the treatment of 10 mg·kg-1 and 15 mg·kg-1 cadmium. The increases were 1.9%~62.3% and 0.6%~128.0%; FeMn-Cd, OM-Cd and RES-Cd FDC showed an increasing trend in most cases after adding magnesium hydroxide, and a few of them decreased. At the end of the incubation, soil EX-Cd FDC under each cadmium level showed a decreasing trend with the increase of magnesium hydroxide addition, and the reducing effect of nMg was better than that of oMg. Compared with the treatment without magnesium hydroxide, soil EX-Cd FDC of nMg and oMg treatments under 1, 5, 10 and 15 mg·kg-1 cadmium treatments decreased by 16.5%~33.8% and 12.4%~31.0% (1 mg·kg-1), 7.8%~17.5% and 2.2%~12.2% (5 mg·kg-1), 14.3%~23.2% and 7.0%~19.1% (10 mg·kg-1), 5.0%~14.4% and 3.2%~10.2% (15 mg·kg-1). On the 28th day of cultivation, the amount of magnesium hydroxide added had different effects on the FDC of CAB-Cd, FeMn-Cd, OM-Cd and RES-Cd, but the effect of nMg was generally greater than that of oMg. Compared with the treatment without magnesium hydroxide, the FDC of CAB-Cd decreased by 4.2%~19.4% and 14.6%~24.7% after the addition of magnesium hydroxide under the 1 mg·kg-1 and 5 mg·kg-1 cadmium treatments, and increased by 15.0%~46.7% and 4.2%~14.9% under the 10 mg·kg-1 and 15 mg·kg-1 cadmium treatments (the oMg-L treatment decreased by 11.7%). The addition of magnesium hydroxide to the soil FeMn-Cd at 1, 5, 10 and 15 mg·kg-1 cadmium treatments increased significantly. The FDC increased by 9.2%~41.3%, 0.8%~46.7%, 11.6%~34.4% and 20.1%~50.6% respectively, the OM-Cd FDC increased by 9.4%~19.6%, 26.1%~68.0%, 3.8%~40.6% and 2.2%~17.0% respectively (oMg-L treatment decreased by 0.5%), and the RES-Cd FDC increased by 3.4%~16.1%, 6.4%~14.9%, 7.1%~29.0% and 8.5%~19.6% respectively.
2.2 Changes in exchangeable Cd content in different types of cadmium-contaminated soils
Heavy metals exist in soils in various chemical forms, among which the exchangeable components have the strongest mobility and bioavailability in the soil environment and are important indicators for evaluating soil heavy metal pollution [5, 16, 17]. The effects of nMg and oMg on the content of soil exchangeable cadmium, the most active in different types of soil, with the change of incubation time were further studied. As shown in Figures 5-8, during the 0th to 28th day of incubation, the change trends of soil EX-Cd content in acidic soil and alkaline soil in 28-day incubation were different. The change trends of soil EX-Cd content in alkaline soil at various cadmium levels with incubation time were consistent, all showing a gradual decrease from the 0th to 7th day of incubation, and reaching the lowest on the 7th day of incubation, an increasing trend from the 7th to the 14th day of incubation, and basically stable from the 14th to the 21st day of incubation, and then decreased again on the 28th day of incubation. The change trends of soil EX-Cd content in acidic soil at various cadmium levels with incubation time were not completely consistent. The changes in soil EX-Cd content in the 1, 5 and 10 mg·kg-1 cadmium treatments showed a gradual decrease from the 0th to the 4th day of incubation, and a minimum on the 7th day of incubation.
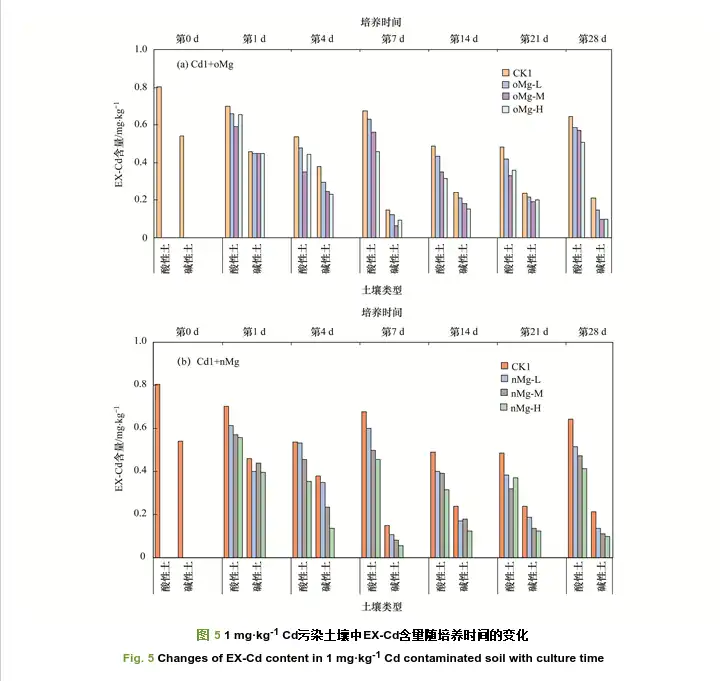
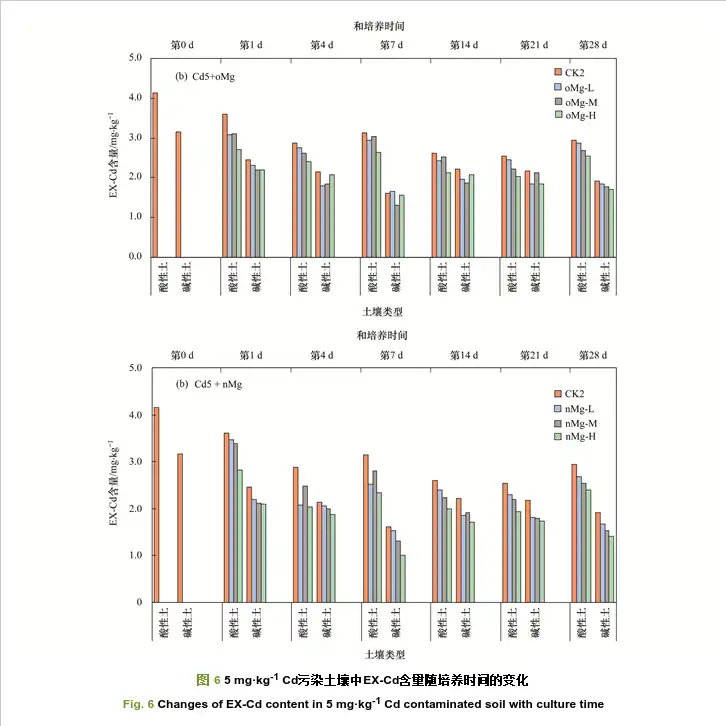
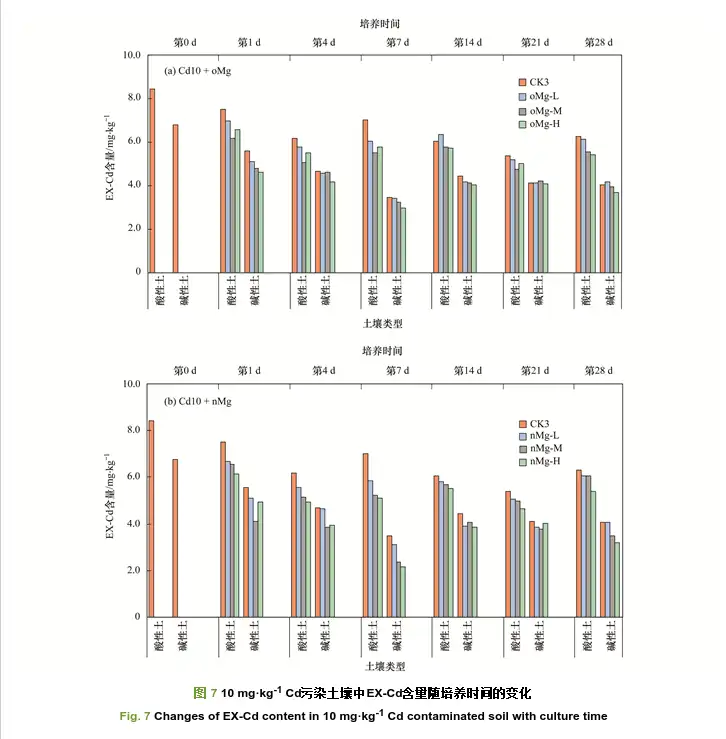
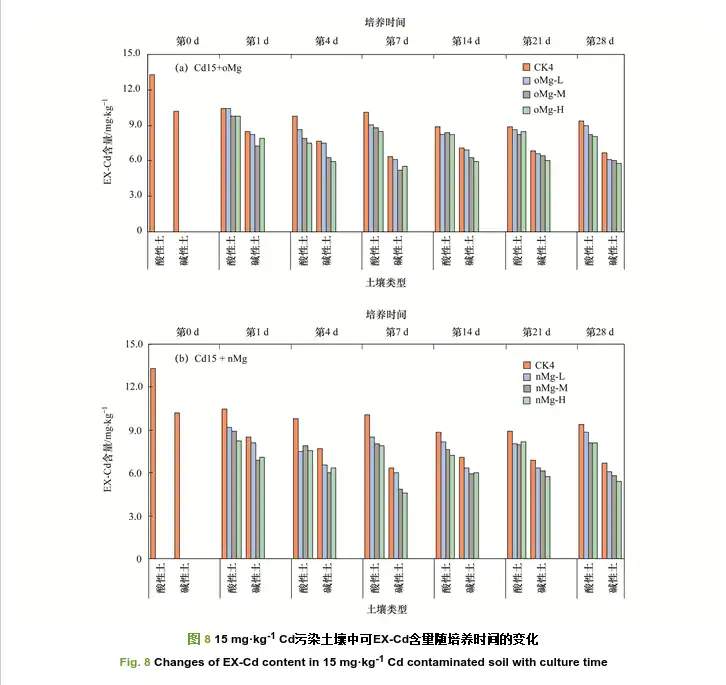
As can be seen from Tables 2 and 3, during the entire incubation process, the soil EX-Cd content of alkaline soil was lower than that of acidic soil. At the end of the 3-week cadmium balance, that is, the 0th day of incubation, the soil EX-Cd contents of acidic soil and alkaline soil under 1, 5, 10 and 15 mg·kg-1 cadmium treatments were 0.805, 4.146, 8.436 and 13.313 mg·kg-1 (acidic soil) and 0.542, 3.161, 6.780 and 10.205 mg·kg-1 (alkaline soil), respectively. On the first day of incubation, the EX-Cd contents of the two soils decreased under each cadmium level. Compared with the 0th day, the EX-Cd contents of 1, 5, 10, 15 and 15 mg·kg-1 cadmium treatments were significantly higher than those of the 0th day. The soil EX-Cd contents of acidic soil and alkaline soil under the cadmium treatment of mg·kg-1 decreased by 12.9%~30.6%, 13.1%~31.9%, 11.1%~27.0%, 21.5%~38.3% (acidic soil) and 15.3%~26.8%, 22.1%~33.6%, 17.7%~39.3%, 16.6%~32.1% (alkaline soil), respectively. On the 4th day of incubation, the soil EX-Cd contents of acidic soil and alkaline soil under each cadmium level continued to decrease. Compared with the corresponding treatment on the 1st day, the soil EX-Cd contents of acidic soil and alkaline soil at 1, 5, 10 and 15 days decreased significantly. The soil EX-Cd contents of acidic soil and alkaline soil under the treatment of mg·kg-1 Cd decreased by 13.4%~36.7%, 10.5%~27.9%, 15.8%~21.6%, 6.4%~23.2% (acidic soil) and 12.8%~66.0%, 5.3%~22.1%, 3.8%~20.0%, 8.6%~25.2% (alkaline soil), respectively. On the 7th day of incubation, the soil EX-Cd contents of acidic soil and alkaline soil under each Cd level showed different changes. The alkaline soil maintained a decreasing trend on the 7th day of incubation and decreased to the minimum value on the 7th day. The soil EX-Cd contents of acidic soil and alkaline soil under each Cd level decreased to the minimum value on the 7th day. The soil EX-Cd contents of alkaline soil decreased to the minimum value on the 1st, 5th, 10th and 15th day. The soil EX-Cd contents under the cadmium treatments of 10 mg·kg-1 and 20 mg·kg-1 were only 0.054-0.149, 1.004-1.648, 2.157-3.479 and 4.585-6.351 mg·kg-1, respectively, which were 57.8%-73.4%, 8.5%-46.6%, 25.7%-45.2% and 9.2%-27.4% lower than those on the 4th day, and 72.5%-90.0%, 47.9%-68.2%, 48.7%-68.2% and 37.8%-55.1% lower than those on the 0th day. In contrast to the changes in alkaline soil, the soil EX-Cd contents under different cadmium levels in acidic soil showed an increasing trend on the 7th day, and decreased by 57.8%-73.4%, 8.5%-46.6%, 25.7%-45.2% and 9.2%-27.4% respectively under the cadmium treatments of 1, 5, 10 and 15 mg·kg-1 compared with those on the 4th day. On the 14th day of cultivation, the soil EX-Cd content of acidic soil and alkaline soil at each cadmium level still showed opposite trends, with acidic soil showing a decreasing trend and alkaline soil showing an increasing trend; on the 21st day of cultivation, the soil EX-Cd content of acidic soil and alkaline soil remained basically stable. At the end of cultivation, that is, on the 28th day of cultivation, the soil EX-Cd content of acidic soil began to rise again, but was generally lower than that on the 0th to 1st day, while that of alkaline soil decreased on the 28th day. The soil EX-Cd content of acidic soil and alkaline soil at 1, 5, 10 and 15 mg·kg-1 cadmium treatments was 0.414~0.644 and 0.098~0.211 mg·kg-1, respectively. mg·kg-1 cadmium treatment), 2.404~2.947 and 1.413~1.913 mg·kg-1 (5 mg·kg-1 cadmium treatment), 5.390~6.288 and 3.212~4.172 mg·kg-1 (10 mg·kg-1 cadmium treatment), 8.091~9.385 and 5.425~6.663 mg·kg-1 (15 mg·kg-1 cadmium treatment).
| Table 2 Changes in the content of EX-Cd in different types of Cd contaminated soil | ||||||||
| 处理 | 土壤可交换态Cd含量/mg·kg-1 | |||||||
| 第1d | 第4 d | 第7 d | ||||||
| 酸性土 | 碱性土 | 酸性土 | 碱性土 | 酸性土 | 碱性土 | |||
| CK1 | 0.701±0.024a | 0.459±0.006a | 0.535±0.007a | 0.380±0.019a | 0.675±0.017a | 0.149±0.011a | ||
| Cd1+oMg-L | 0.661±0.017b | 0.450±0.018a | 0.479±0.019b | 0.294±0.009c | 0.628±0.012b | 0.124±0.003b | ||
| Cd1+oMg-M | 0.591±0.02cd | 0.447±0.008a | 0.348±0.013d | 0.244±0.016d | 0.560±0.015c | 0.065±0.004f | ||
| Cd1+oMg-H | 0.654±0.001b | 0.450±0.016a | 0.445±0.015c | 0.232±0.007d | 0.459±0.021e | 0.096±0.003d | ||
| Cd1+nMg-L | 0.613±0.018c | 0.398±0.005b | 0.531±0.002a | 0.347±0.015b | 0.599±0.016b | 0.108±0.005c | ||
| Cd1+nMg-M | 0.570±0.019d | 0.438±0.015a | 0.457±0.005bc | 0.232±0.005d | 0.498±0.010d | 0.083±0.001e | ||
| Cd1+nMg-H | 0.559±0.003d | 0.397±0.013b | 0.354±0.019d | 0.135±0.004e | 0.457±0.003e | 0.054±0.002f | ||
| CK2 | 3.602±0.020a | 2.461±0.022a | 2.875±0.055a | 2.139±0.009a | 3.137±0.065a | 1.608±0.074a | ||
| Cd5+oMg-L | 3.076±0.096c | 2.312±0.088b | 2.754±0.077a | 1.802±0.062c | 2.933±0.039b | 1.648±0.028a | ||
| Cd5+oMg-M | 3.105±0.046c | 2.190±0.082bc | 2.623±0.027b | 1.847±0.02bc | 3.031±0.049ab | 1.313±0.011b | ||
| Cd5+oMg-H | 2.718±0.030d | 2.192±0.026bc | 2.402±0.025c | 2.075±0.063a | 2.645±0.034d | 1.568±0.037a | ||
| Cd5+nMg-L | 3.462±0.049ab | 2.203±0.065bc | 2.068±0.067d | 2.049±0.087a | 2.517±0.031e | 1.540±0.045a | ||
| Cd5+nMg-M | 3.379±0.090b | 2.110±0.013c | 2.470±0.054c | 1.988±0.020ab | 2.810±0.059c | 1.308±0.056b | ||
| Cd5+nMg-H | 2.822±0.042d | 2.099±0.043c | 2.036±0.056d | 1.880±0.102bc | 2.341±0.035f | 1.004±0.016c | ||
| CK3 | 7.496±0.062a | 5.579±0.062a | 6.199±0.144a | 4.687±0.057a | 7.008±0.085a | 3.479±0.072a | ||
| Cd10+oMg-L | 6.972±0.100b | 5.107±0.070b | 5.773±0.106b | 4.584±0.099a | 6.056±0.084b | 3.407±0.108a | ||
| Cd10+oMg-M | 6.179±0.078d | 4.819±0.036c | 5.071±0.072d | 4.634±0.103a | 5.498±0.051d | 3.243±0.048b | ||
| Cd10+oMg-H | 6.571±0.079c | 4.603±0.010e | 5.532±0.035c | 4.165±0.045b | 5.768±0.074c | 2.986±0.016c | ||
| Cd10+nMg-L | 6.663±0.104c | 5.090±0.038b | 5.567±0.079bc | 4.652±0.029a | 5.855±0.109c | 3.103±0.036bc | ||
| Cd10+nMg-M | 6.575±0.048c | 4.115±0.062f | 5.154±0.067d | 3.853±0.110c | 5.238±0.079e | 2.384±0.040d | ||
| Cd10+nMg-H | 6.161±0.015d | 4.918±0.020c | 4.940±0.090d | 3.933±0.023c | 5.123±0.045e | 2.157±0.088e | ||
| CK4 | 10.450±0.037a | 8.509±0.065a | 9.781±0.049a | 7.698±0.117a | 10.070±0.071a | 6.351±0.031a | ||
| Cd15+oMg-L | 10.406±0.012a | 8.193±0.091b | 8.680±0.101b | 7.486±0.086b | 9.015±0.097b | 6.101±0.042b | ||
| Cd15+oMg-M | 9.792±0.121b | 7.294±0.015d | 7.897±0.083c | 6.289±0.081d | 8.775±0.085c | 5.236±0.108d | ||
| Cd15+oMg-H | 9.788±0.084b | 7.929±0.055c | 7.521±0.095d | 5.928±0.115e | 8.491±0.066d | 5.532±0.102c | ||
| Cd15+nMg-L | 9.165±0.106c | 8.103±0.062b | 7.523±0.073d | 6.587±0.030c | 8.484±0.031d | 5.984±0.082b | ||
| Cd15+nMg-M | 8.895±0.075d | 6.925±0.022e | 7.873±0.017c | 6.013±0.090e | 8.010±0.043e | 4.877±0.025e | ||
| Cd15+nMg-H | 8.216±0.098e | 7.071±0.085e | 7.575±0.002d | 6.318±0.061d | 7.932±0.014e | 4.585±0.019f | ||
| Table 3 Changes in the content of EX-Cd in different types of Cd contaminated soil | ||||||||
| 处理 | 土壤可交换态Cd含量/mg·kg-1 | |||||||
| 第14 d | 第21 d | 第28 d | ||||||
| 酸性土 | 碱性土 | 酸性土 | 碱性土 | 酸性土 | 碱性土 | |||
| CK1 | 0.489±0.010a | 0.240±0.007a | 0.484±0.009a | 0.238±0.004a | 0.644±0.007a | 0.211±0.006a | ||
| Cd1+oMg-L | 0.434±0.003b | 0.210±0.002b | 0.421±0.014b | 0.215±0.014b | 0.587±0.019b | 0.146±0.008b | ||
| Cd1+oMg-M | 0.348±0.011d | 0.183±0.005c | 0.330±0.009d | 0.191±0.012c | 0.571±0.015b | 0.101±0.003cd | ||
| Cd1+oMg-H | 0.314±0.013e | 0.151±0.011d | 0.359±0.013c | 0.200±0.008bc | 0.508±0.017c | 0.097±0.006d | ||
| Cd1+nMg-L | 0.399±0.012c | 0.171±0.008c | 0.382±0.006c | 0.187±0.002c | 0.514±0.003c | 0.134±0.005b | ||
| Cd1+nMg-M | 0.393±0.014c | 0.178±0.010c | 0.319±0.015d | 0.138±0.006d | 0.472±0.021d | 0.112±0.009c | ||
| Cd1+nMg-H | 0.317±0.001e | 0.123±0.003e | 0.372±0.007c | 0.122±0.009d | 0.414±0.014e | 0.098±0.004d | ||
| CK2 | 2.607±0.085a | 2.209±0.056a | 2.540±0.065a | 2.177±0.039a | 2.947±0.023a | 1.913±0.063a | ||
| Cd5+oMg-L | 2.430±0.022b | 1.972±0.044bc | 2.447±0.013a | 1.847±0.060b | 2.868±0.052a | 1.850±0.042ab | ||
| Cd5+oMg-M | 2.513±0.067ab | 1.866±0.067cd | 2.213±0.018b | 2.115±0.039a | 2.690±0.007b | 1.775±0.038abc | ||
| Cd5+oMg-H | 2.122±0.076de | 2.071±0.085ab | 2.042±0.052c | 1.855±0.059b | 2.548±0.046c | 1.700±0.103bc | ||
| Cd5+nMg-L | 2.393±0.061bc | 1.858±0.065cd | 2.307±0.080b | 1.806±0.088b | 2.687±0.008b | 1.675±0.061cd | ||
| Cd5+nMg-M | 2.243±0.059cd | 1.914±0.082bc | 2.201±0.016b | 1.801±0.051b | 2.547±0.071c | 1.538±0.083de | ||
| Cd5+nMg-H | 2.003±0.053e | 1.715±0.089d | 1.934±0.091c | 1.738±0.019b | 2.404±0.034d | 1.413±0.026e | ||
| CK3 | 6.037±0.102b | 4.454±0.016a | 5.378±0.012a | 4.125±0.035ab | 6.288±0.087a | 4.066±0.025ab | ||
| Cd10+oMg-L | 6.365±0.111a | 4.174±0.105b | 5.182±0.014b | 4.150±0.048ab | 6.116±0.088ab | 4.172±0.014a | ||
| Cd10+oMg-M | 5.800±0.079c | 4.134±0.034b | 4.746±0.097d | 4.200±0.054a | 5.560±0.077c | 3.961±0.065b | ||
| Cd10+oMg-H | 5.718±0.101c | 4.060±0.083bc | 5.042±0.027bc | 4.088±0.026ab | 5.433±0.026c | 3.679±0.093c | ||
| Cd10+nMg-L | 5.807±0.062c | 3.896±0.050cd | 5.072±0.033bc | 3.850±0.035c | 6.068±0.109b | 4.054±0.033ab | ||
| Cd10+nMg-M | 5.683±0.048cd | 4.070±0.104bc | 4.983±0.053c | 3.787±0.103c | 6.055±0.087b | 3.466±0.012d | ||
| Cd10+nMg-H | 5.501±0.009d | 3.852±0.086d | 4.636±0.099d | 4.038±0.054b | 5.390±0.070c | 3.212±0.040e | ||
| CK4 | 8.855±0.079a | 7.098±0.091a | 8.911±0.029a | 6.879±0.099a | 9.385±0.048a | 6.663±0.069a | ||
| Cd15+oMg-L | 8.225±0.032abc | 6.968±0.098a | 8.671±0.061b | 6.630±0.084b | 8.941±0.064b | 6.088±0.095b | ||
| Cd15+oMg-M | 8.389±0.018ab | 6.277±0.016b | 8.270±0.064d | 6.433±0.111bc | 8.268±0.056c | 6.012±0.046b | ||
| Cd15+oMg-H | 8.208±0.093abc | 5.947±0.026c | 8.439±0.087c | 6.040±0.104e | 8.100±0.095c | 5.800±0.034c | ||
| Cd15+nMg-L | 8.180±0.066abc | 6.326±0.017b | 8.064±0.087ef | 6.365±0.082cd | 8.855±0.100b | 6.100±0.027b | ||
| Cd15+nMg-M | 7.630±0.830bc | 5.969±0.097c | 7.958±0.060f | 6.160±0.072de | 8.139±0.077c | 5.812±0.086c | ||
| Cd15+nMg-H | 7.213±0.788c | 6.028±0.044c | 8.157±0.088de | 5.753±0.105f | 8.091±0.082c | 5.425±0.109d | ||
Overall, the addition of magnesium hydroxide significantly reduced the soil EX-Cd content of acidic soil and alkaline soil (P < 0.05). With the increase of magnesium hydroxide addition, the soil EX-Cd content showed a decreasing trend, and nMg was better than oMg in reducing soil EX-Cd content. During the 0-28 days of incubation, compared with the treatment without magnesium hydroxide at the corresponding incubation time, nMg and oMg treatments reduced the soil EX-Cd content of acidic soil at 1, 5, 10 and 15 The EX-Cd contents in soils under the cadmium treatments of mg·kg-1 were reduced by 0.7%~35.7%, 3.9%~29.2%, 3.5%~26.9%, 5.6%~23.1% (nMg), 5.7%~35.8%, 2.7%~24.5%, 2.7%~21.5% (oMg increased by 5.4% at the 14th day), and 0.4%~23.1% (oMg), respectively. The EX-Cd contents in alkaline soils were reduced by 4.6%~63.8%, 4.2%~26.1%, 0.7%~38.0%, 4.8%~27.8% (nMg), 2.0%~54.0%, 2.5%~15.8% (oMg increased by 2.5% at the 7th day), 1.1%~17.5% (oMg increased by 2.5% at the 21st day), respectively. The content of EX-Cd in soil of acidic soil increased by 0.130-0.230 mg·kg-1 and 0.057-0.136 mg·kg-1 (in the treatment of 1 mg·kg-1 cadmium), 0.260-0.543 mg·kg-1 and 0.079-0.399 mg·kg-1 (in the treatment of 5 mg·kg-1 cadmium), and 0.220-0.898 mg·kg-1 (in the treatment of 1 mg·kg-1 cadmium), respectively, compared with the treatment without magnesium hydroxide. The content of cadmium in alkaline soil decreased by 0.077~0.113 mg·kg-1 and 0.065~0.114 mg·kg-1 (under 1 mg·kg-1 cadmium treatment), 0.238~0.500 mg·kg-1 and 0.063~0.213 mg·kg-1 (under 5 mg·kg-1 cadmium treatment), 0.012~0.854 mg·kg-1 and 0.105~0.387 mg·kg-1 (under 10 mg·kg-1 cadmium treatment), 0.530~1.294 mg·kg-1 and 0.444~1.285 mg·kg-1 (under 15 mg·kg-1 cadmium treatment), respectively. During the whole incubation period, with the increase of nMg and oMg addition, the soil EX-Cd content of acidic soil and alkaline soil generally showed a decreasing trend (except for a few treatments with an increasing trend during the incubation process). Compared with the low oMg treatment (oMg-L), the soil EX-Cd content of 1, 5, 10 and 15 mg·kg-1 cadmium was 0.563~1.238 mg·kg-1 and 0.575~0.863 mg·kg-1 (when 15 mg·kg-1 cadmium was treated). The oMg-M and oMg-H treatments under the mg·kg-1 Cd treatment reduced the soil EX-Cd content in acidic soil by 2.7%~27.3%, 4.8%~9.6%, 8.4%~12.2%, 2.7%~9.0% (oMg-M) and 1.1%~27.6%, 9.8%~16.6%, 2.7%~11.2%, 0.2%~13.4% (oMg-H), respectively, and reduced the soil EX-Cd content in alkaline soil by 0.7%~47.6%, 5.3%~20.3%, 1.0%~5.6%, 3.0%~16.0% (oMg-M) and 7.0%~28.1%, 4.9%~5.2%, 1.5%~12.4%, 3.2%~20.8% (oMg-H), respectively. Compared with the low nMg treatment (nMg-L), The nMg-M and nMg-H treatments at 1, 5, 10, and 15 mg kg-1 Cd reduced soil EX-Cd contents in acidic soil by 1.5%-16.9%, 2.4%-6.3%, 0.2%-10.5%, and 1.3%-8.1% (nMg-M) and 2.6%-33.3%, 1.5%-18.5%, 5.3%-11.3%, and 6.5%-11.8% (nMg-H), respectively. The soil EX-Cd content of alkaline soil was reduced by 16.4%~33.1%, 0.3%~15.1%, 1.6%~23.2%, 3.2%~18.5% (nMg-M) and 0.3%~61.1%, 3.8%~34.8%, 1.1%~30.5%, 4.1%~23.4% (nMg-H), respectively. When the amount of magnesium hydroxide added was the same, nMg showed a better effect on reducing soil EX-Cd content. Compared with the oMg treatment with the corresponding addition amount, the nMg treatments of acidic soil and alkaline soil at 1, 5, 10 and 15 The soil EX-Cd content under the 1 mg·kg-1 cadmium treatment decreased by 0.4%~20.4%, 0.5%~24.9%, 0.8%~11.2%, 0.1%~16.1% (acidic soil) and 2.0%~43.8%, 0.4%~36.0%, 0.3%~27.8%, 1.1%~17.1% (alkaline soil).
2.3 Correlation between soil pH and soil exchangeable Cd content
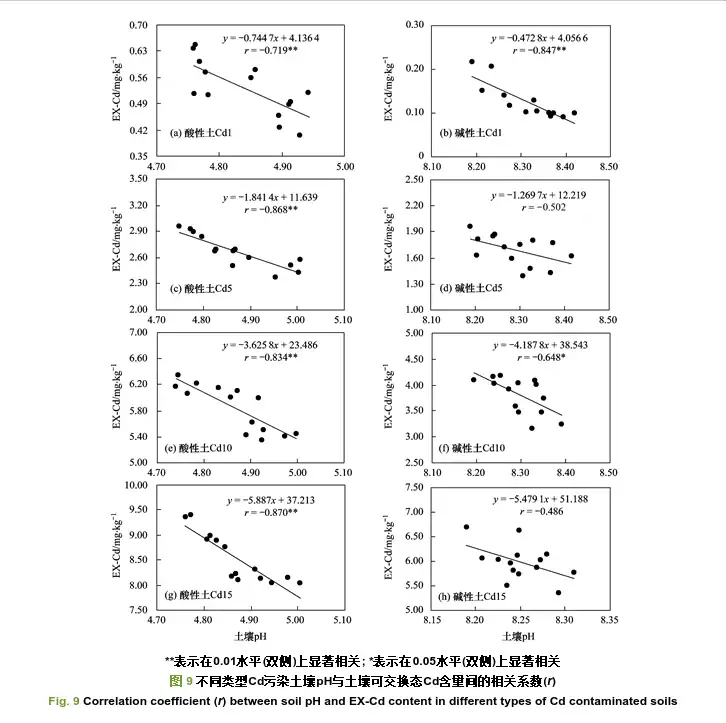
As shown in Figure 9, the soil EX-Cd content of both acidic and alkaline soils showed a decreasing trend with the increase of soil pH under each cadmium level, showing a linear negative correlation. Under the 1 mg·kg-1 cadmium treatment, there was a very significant negative correlation between soil pH and soil EX-Cd content in acidic and alkaline soils (P < 0.01), with correlation coefficients of -0.719 and -0.847; at 5 There was an extremely significant negative correlation between soil pH and soil EX-Cd content in acidic soil under the treatment of 10 mg·kg-1 cadmium (P < 0.01), with a correlation coefficient of -0.868, but the correlation in alkaline soil did not reach a significant level (P>0.05), with a correlation coefficient of only -0.502; the correlation between soil pH and soil EX-Cd content in acidic soil under the treatment of 10 mg·kg-1 cadmium reached an extremely significant level (P < 0.01), with a correlation coefficient of -0.834, and the correlation in alkaline soil reached a significant level (P < 0.05), with a correlation coefficient of -0.648; the correlation under the treatment of 15 mg·kg-1 cadmium was similar to that under the treatment of 5 mg·kg-1 cadmium, and there was an extremely significant negative correlation between soil pH and soil EX-Cd content in acidic soil (P < 0.01), with a correlation coefficient of -0.870, but the correlation in alkaline soil was weak and did not reach a significant level (P>0.05), The correlation coefficient is only -0.486.
3 Discussion
On neutral soil, after 3 weeks of cadmium balance, soil EX-Cd FDC increased with the increase of exogenous cadmium level. The soil EX-Cd FDC under 1, 5, 10 and 15 mg·kg-1 cadmium treatments were 66.7%, 73.7%, 77.4% and 81.8%, respectively, which were much higher than the FDC of the other four forms of cadmium. This is consistent with the research results of Xiong Shijuan [3]. The reason may be that when the soil cadmium level is high under natural conditions, the process of metal conversion from loosely bound parts (such as exchangeable parts) to strongly bound parts (such as iron and manganese oxidation and organic matter binding parts) is relatively slow [18, 19]. During the 28-day incubation process, the soil EX-Cd FDC decreased significantly with the extension of incubation time. Overall, soil cadmium mainly existed in the form of EX-Cd, which is consistent with the research results of Shao Liqun [20].
The neutral soil EX-Cd FDC showed a downward trend under 1, 5, 10 and 15 mg·kg-1 cadmium treatments. The FDC of soil CAB-Cd, FeMn-Cd, OM-Cd and RES-Cd all increased. On the 4th to 14th day of cultivation, the FDC of soil EX-Cd and CAB-Cd under the 1 mg·kg-1 and 5 mg·kg-1 cadmium treatments gradually decreased and reached the minimum value during the entire cultivation process. The FDC of soil FeMn-Cd, OM-Cd and RES-Cd all gradually increased. Under the 10 mg·kg-1 and 15 mg·kg-1 cadmium treatments, soil EX-Cd began to rise, soil FeMn-Cd and OM-Cd FDC continued to increase, while CAB-Cd and RES-Cd FDC showed a downward trend. On the 28th day of cultivation, the changes in soil Cd forms under various cadmium treatments had not yet reached equilibrium. The FDC of soil EX-Cd still had an upward trend, the FDC of soil CAB-Cd decreased, and other forms did not change much. This result is different from the research results of Liu Lijuan [21]. However, it is similar to the research results of Cao Sheng [22]. The reason may be that Cd2+ undergoes various physical and chemical reactions with the soil and gradually transforms into a less active chemical form. As the proportion of active form content tends to stabilize, the less active chemical form slowly transforms into an even less active chemical form [23]. The soil EX-Cd FDC slightly rebounded at the end of the incubation because other metal ions in the soil compete with Cd, so it slightly increased in the later period [24].
The addition of nMg and oMg reduced the neutral soil EX-Cd FDC and also reduced the soil CAB-Cd FDC in the 1 mg·kg-1 and 5 mg·kg-1 cadmium treatments. This shows that magnesium hydroxide and incubation time can better reduce the active cadmium content in the soil under low cadmium conditions. Wang Liqun et al. [25] also found in the comparison of the time effect of different passivators that in high cadmium-contaminated soil, the incubation time did not have a significant effect on the passivation effect as in low cadmium-contaminated soil. This is mainly because most of the passivators have been saturated with Cd pollutants and their passivation capacity is limited. Therefore, as the incubation time increases, The passivation effect did not change much. This experiment also found that the addition of magnesium hydroxide increased the FDC of FeMn-Cd, OM-Cd and RES-Cd under each cadmium treatment. At the end of the incubation, the soil EX-Cd FDC in each cadmium level treatment showed a decreasing trend with the increase of magnesium hydroxide addition, and the reduction effect of nMg was better than that of oMg. This shows that both nMg and oMg had a certain passivation effect on soil cadmium, and the effect of nMg was better than that of oMg. Under the 1 mg·kg-1 and 5 mg·kg-1 cadmium treatments, the addition of two kinds of magnesium hydroxide promoted the conversion of soil EX-Cd and CAB-Cd to FeMn-Cd, OM-Cd and RES-Cd, and under the 10 mg·kg-1 and 15 mg·kg-1 cadmium treatment promoted the transformation of soil EX-Cd into CAB-Cd, FeMn-Cd, OM-Cd and RES-Cd. This is similar to the results of Wu Yan et al. [26] and Wang Xiuli et al. [27]. The reason may be that Cd and Mg have the same extranuclear electrons and similar ionic radius, competing for exchange sites in soil adsorption [28], resulting in antagonism between the absorption and enrichment of Cd and Mg in the soil [29~31]. Zhai Dewei et al. [32] used nMg to treat chromium-containing wastewater and achieved good results, and the treatment effect of nMg was better than that of oMg.
During the whole cultivation process, the soil EX-Cd content of alkaline soil was lower than that of acidic soil. This may be related to the different physical and chemical properties of soil clay mineral composition, organic matter content, etc., or it may be because the pH of alkaline soil is higher than that of acidic soil, which gradually increases the alkaline groups in the soil solution such as OH-, SiO32- and CO32-. It promoted the formation of hydroxide and silicate precipitation, and then reduced the content of available heavy metals [33]. During the 28 days of incubation, the change trends of soil EX-Cd content in acidic soil and alkaline soil were different. The change trends of soil EX-Cd content in alkaline soil at various cadmium levels with incubation time were consistent, showing a gradual decrease from the 0th to the 7th day of incubation, and reached the lowest on the 7th day of incubation, which was 37.8%~90.0% lower than that on the 0th day. It showed an increasing trend from the 7th to the 14th day of incubation, and basically stabilized from the 14th to the 21st day of incubation, and then decreased again on the 28th day of incubation. The change trends of soil EX-Cd content in acidic soil at various cadmium levels with incubation time were not completely consistent. The changes in soil EX-Cd content in the 1, 5 and 10 mg·kg-1 cadmium treatments showed a gradual decrease from the 0th to the 4th day of incubation, a slight increase on the 7th day, and a gradual decrease from the 7th to the 21st day of incubation. The lowest value was reached on the 21st day, which was 36.2%~60.4% lower than that on the 0th day, but it began to rise again on the 21st to 28th day. Under the 15 mg·kg-1 cadmium treatment, the soil EX-Cd content of different treatments did not show a consistent change pattern during the cultivation period. It was roughly manifested as a gradual decrease from the 0th to the 4th day of cultivation, and began to rise from the 4th to the 7th day, and then began to decrease from the 7th to the 14th day, and then stabilized from the 14th to the 28th day of cultivation. This shows that the soil under alkaline conditions can fix the exchangeable cadmium in the soil more quickly and reduce the exchangeable cadmium content in the soil, but the two soils did not reach equilibrium within 28 days of cultivation. This result is similar to the research results of Huang Min et al. [31], but also different. In this study, the effective cadmium content of alkaline soil decreased rapidly from the 0th to the 14th day of cultivation under low cadmium (3 mg·kg-1) conditions, and did not change significantly from the 14th to the 28th day. mg·kg-1) under the condition of cadmium pollution, it quickly reached equilibrium on the 7th day of cultivation; the effective cadmium content in acidic soil decreased rapidly from the 0th to the 7th day of cultivation after adding calcium magnesium phosphate under the condition of 3 mg·kg-1 cadmium pollution, rebounded from the 7th to the 14th day, and gradually decreased from the 14th to the 28th day. This shows that calcium magnesium phosphate can quickly react with the effective cadmium in the soil to reach dynamic equilibrium in alkaline soil, but reacts slowly with the effective cadmium in acidic soil and does not reach dynamic equilibrium on the 28th day of cultivation. This shows that regardless of acidic or alkaline soil, as the cultivation time increases, the applied regulator can enhance the soil’s fixation and adsorption of exchangeable cadmium, but the dynamic equilibrium time of the change in soil exchangeable cadmium content may be related to factors such as the type of regulator, environmental conditions, and soil physical and chemical properties [34]. Su Binglin et al. [24] reported that when nano-iron oxide was added to the soil under the condition of 50% maximum field water holding capacity, During the entire cultivation period of 0-120 days, the effective soil cadmium showed a trend of first decreasing and then increasing.
Magnesium has a certain surface direct adsorption and ion exchange effect on soil Cd, which can regulate the effectiveness of cadmium in the soil [35, 36]. Overall, the addition of magnesium hydroxide significantly reduced the soil EX-Cd content of acidic soil and alkaline soil (P < 0.05), and the soil EX-Cd content showed a decreasing trend with the increase of magnesium hydroxide addition. This shows that magnesium hydroxide has a passivation effect on exchangeable cadmium in both soils [36]. On the other hand, the decrease in soil exchangeable cadmium content may also be due to the increase in soil pH caused by the application of nMg and oMg. In this experiment, the addition of magnesium hydroxide increased the soil pH of the two soils at each cadmium level, and it showed an increasing trend with the increase of the application amount; whether it is acidic soil or alkaline soil, the soil EX-Cd content between treatments at each cadmium level generally showed a decreasing trend with the increase of soil pH, showing a linear negative correlation trend. The experiment also found that nMg was more effective than oMg in reducing soil EX-Cd content, but the effect of magnesium hydroxide type on soil pH did not reach a significant level. This indicates that nMg has a better effect in reducing soil EX-Cd content mainly because nanoparticles have a huge specific surface area, which can enhance the adsorption of soil heavy metals [37]. The research results of Chi Sunlin et al. [23] also found that in exogenous cadmium-contaminated soil, the effect of applying nano zeolite on reducing the exchangeable cadmium content in soil was better than that of ordinary zeolite. Overall, the addition of magnesium hydroxide is more conducive to enhancing the correlation between soil pH and soil EX-Cd content in acidic soil. This may be because magnesium hydroxide is a medium-strong base with a pH value of 10.4 in a saturated aqueous solution. After adding magnesium hydroxide to the soil, it can cause pH fluctuations in acidic soil [38]. This is consistent with the research results of Huang Min et al. [31].
4 Conclusion
(1) On neutral soil, during the 28-day incubation process, soil EX-Cd under 1, 5, 10 and 15 mg kg-1 cadmium treatments was significantly different from that under 1, 5, 10 and 15 mg kg-1 cadmium treatments. As the incubation time increased, FDC first decreased, then increased, and then tended to be stable. It slightly rebounded at the end of the incubation period, but did not reach a dynamic equilibrium. It reached its minimum value on the 14th day under the 1 mg·kg-1 and 5 mg·kg-1 cadmium treatments, and on the 4th day under the 10 and 15 mg·kg-1 cadmium treatments. The change trend of soil CAB-Cd, FeMn-Cd, and OM-Cd FDC during the incubation process was opposite to that of soil EX-Cd FDC, which first increased, then decreased, and then tended to be stable, reaching a maximum on the 4th day and a minimum on the 14th day. Soil RES-Cd FDC generally showed a trend of gradually increasing and then tending to be stable during the incubation process.
(2) Both nMg and oMg reduced the exchangeable cadmium content in acidic and alkaline soils. The EX-Cd content of alkaline soil reached its minimum on the 7th day of incubation; the EX-Cd content of acidic soil reached its minimum on the 21st day under the 1, 5, and 10 mg·kg-1 cadmium treatments. The lowest value was reached at d. At the same dosage, the effect of nMg on passivating soil active cadmium was greater than that of oMg.
