Like calcium carbonate, magnesium carbonate also has a cementing effect, and the strength of magnesium ore is much greater than that of calcium ore. Therefore, it is of great significance to study the solidification technology of magnesium carbonate. In this paper, the absorbance and urease activity of Bacillus pasteurianus during the culture process were measured, and the unit urease activity was calculated; the effects of urea, sodium chloride, acetate, Ca2+ and Mg2+ concentrations on urease activity were studied; the precipitation efficiency of calcium and magnesium and the yield of magnesium carbonate precipitation at different temperatures and different urea concentrations were compared by controlling temperature, pH value and ion concentration; the solidification effect of sand under calcium carbonate and magnesium carbonate precipitation was compared.
The results showed that during the 48 h culture process, the growth of absorbance and urease activity first slowed down, then increased rapidly, then decreased and finally stopped, while the unit urease activity first increased and then decreased. Appropriately increasing the concentration of urea or Mg2+ can enhance the bacterial urease activity, the concentration of sodium chloride and acetate has no significant effect on the enzyme activity, and the concentration of Ca2+ has a significant inhibitory effect on the urease activity. Under the same temperature, pH value and ion concentration, the yield of magnesium carbonate is significantly lower than that of calcium carbonate. Adding urea to the bacterial solution can promote the precipitation of magnesium carbonate, and at the same temperature, the higher the urea concentration, the greater the yield of magnesium carbonate. Adding urea to the bacterial solution can make the magnesium carbonate-solidified sand take shape and have a certain strength. Therefore, this method can solve the problem of insufficient magnesium carbonate precipitation in sand solidification, laying the foundation for subsequent magnesium carbonate solidification experiments.
Introduction
The microbial solidification technology was first proposed by Whiffin[1]. The core of this technology is to decompose carbonate ions and combine them with metal cations to form mineral precipitates with cementing effects[2]. Due to the wide application of calcium carbonate precipitation, biomineralization technology has been widely studied in different fields in recent years[3]. For example, the use of microorganisms to induce calcium carbonate can be used for bioremediation, solidification of inorganic pollutants, and sealing of cracks in rocks or porous materials[4].
In recent years, Jiang et al.[5] studied the urease activity of microorganisms under different temperature and pH conditions. In terms of sand solidification, Martinez et al.[6] solidified 50 cm long sand columns and studied the uniformity of solidification. Harkes et al.[7] proposed a related process for solidification uniformity.
The generated magnesium carbonate precipitate also has cementing properties, and the strength of natural magnesium ore is much greater than that of calcium ore. However, almost no one has yet studied the induction of magnesium carbonate precipitation to solidify sand. Therefore, studying magnesium carbonate to solidify sand and improve its strength is of great significance to microbial solidification technology. This paper first studies the changes in absorbance, urease activity and unit urease activity of Bacillus pasteurianus during the culture process [1, 8], and then analyzes the influence of various factors on urease activity; then compares the precipitation efficiency of calcium carbonate and magnesium carbonate at different temperatures and the precipitation yield of magnesium carbonate under the conditions of adding different urea concentrations to the bacterial solution; finally, calcium acetate and magnesium acetate are used to solidify sand, and the solidification effect is compared and analyzed, laying a foundation for the subsequent sedimentation of magnesium carbonate to solidify sand test.
1 Experimental materials and methods
1.1 Experimental materials
The strain used in the sand solidification test is Sporosarcina pasteurii. The main components of the culture medium are nutrient broth and yeast extract.
1.2 Experimental methods
This paper directly uses the absorbance OD600 value measured by a spectrophotometer at a wavelength of 600 nm to represent the bacterial concentration. When the absorbance is in the range of 0.2~0.8, the cell concentration per milliliter Y is calculated by the formula [9] Y=8.59*107Z1.3627, where Z is the OD600 value; if it exceeds this range, it needs to be diluted before conversion. As for urease activity, since the amount of urea hydrolysis is proportional to the change in solution conductivity, it can be obtained by measuring the change in conductivity per minute [1]. Therefore, 3 mL of the tested bacterial solution was mixed with 27 mL of urea solution at room temperature, and the conductivity change within 5 min was monitored using a conductivity meter and the average change per minute was calculated. Then it was converted into the amount of urea hydrolyzed per minute. Therefore, this article uses this value to represent the urease activity, and the unit is M ureahydrolysed/min[1,8].
2 Bacterial growth and urease activity change
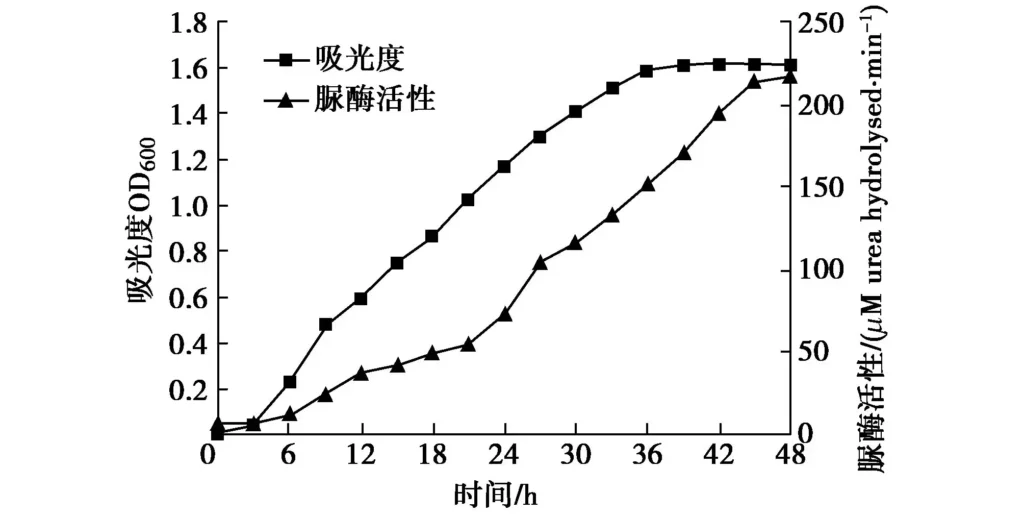
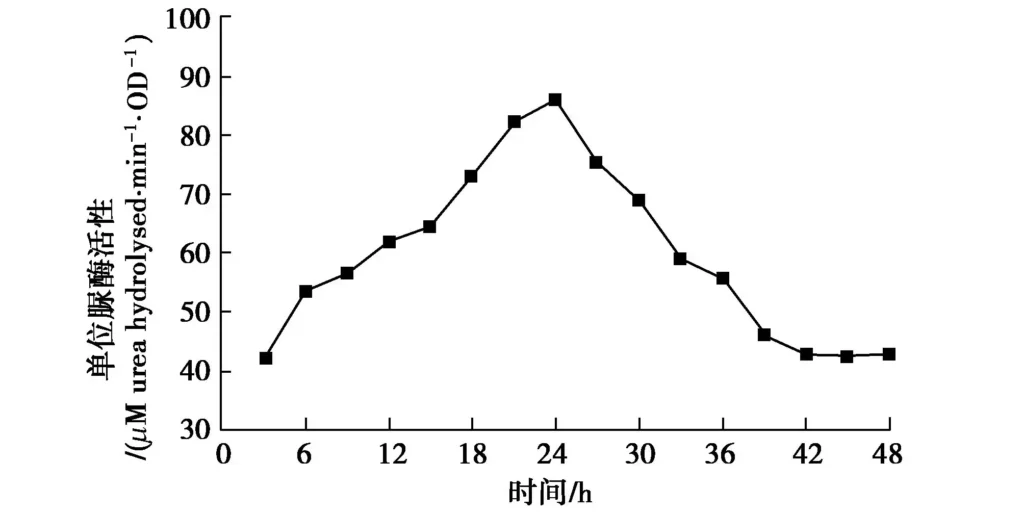
The activated bacteria were inoculated into the culture medium at 1%, and placed in a 30℃ incubator for continuous culture for 48 h (oscillation frequency was 100 rpm). The OD600 value was measured every 3 h using a spectrophotometer, and the urease activity of the bacterial solution was detected using a conductivity meter. With time as the horizontal axis, bacterial concentration (OD600) and urease activity as the vertical axis, a curve was drawn as shown in Figure 1. Figure 2 shows the change in unit urease activity.
As shown in Figure 1, the number of bacteria species grows very slowly at the beginning, and only a small part of the cells divide, which is in the delay period. After that, the bacterial growth enters the logarithmic phase, and the number grows geometrically. At this stage, the cell metabolism is strong and the growth rate is fast. Then, with the consumption of nutrients in the culture medium and the continuous accumulation of harmful metabolites, the newly proliferated and dead bacteria gradually become equal and are in a stable period. Therefore, Bacillus pasteurianus cultured for 33 to 36 hours is generally selected for testing. The trend of the urease activity curve is generally consistent with the growth curve. With the increase of time and bacterial concentration, the urease activity increases, and the ability to catalyze urea hydrolysis also gradually increases. However, the unit urease activity in Figure 2 increases continuously at the beginning, peaks at 24 hours, then begins to decline, and finally stabilizes. Therefore, it can be seen that the bacterial utilization rate is the highest at 24 hours.
3 Effects of different factors on urease activity
3.1 Urea concentration
Urea is an important raw material in the MICP process and an important factor affecting the MICP effect. Studies have shown that the presence of urea can induce bacteria to produce urease[10]. To study the effect of urea concentration on urease activity, 54 mL of 0.2, 0.4, 0.6, 0.8, 1.0, 1.2, 1.4, 1.6, 1.8, and 2.0 M urea solutions were prepared, and 6 mL of bacterial solution (OD600 of 0.6, 0.9, 1.2, and 1.5, respectively) was added to the solutions. The conductivity change within 5 min at 30°C and pH 7 was measured, and the bacterial urease activity at different urea concentrations was calculated, as shown in Figure 3.
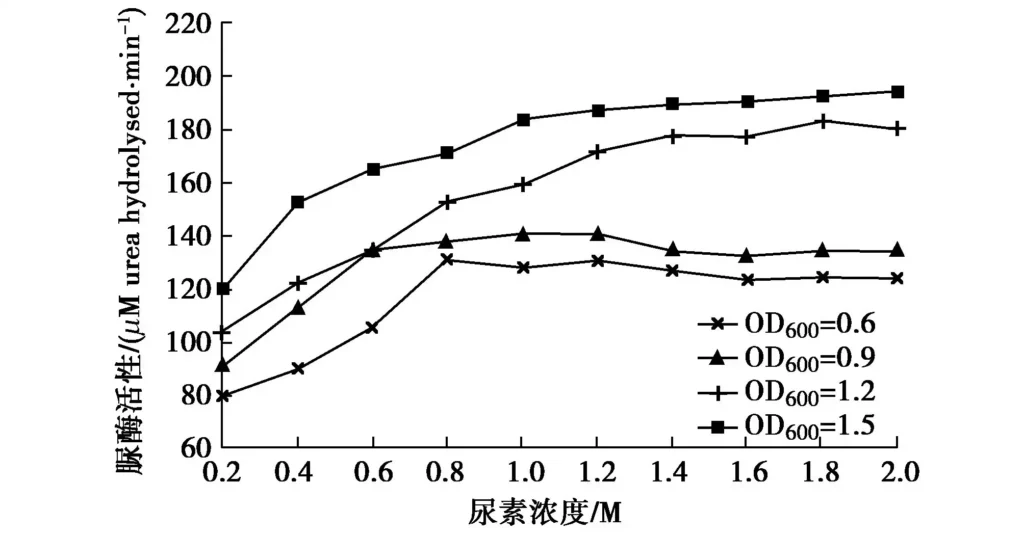
With the increase of urea concentration, urease activity began to increase significantly, especially between 0.2 and 0.6 M. The urease activity of bacterial solution with OD600 exceeding 1.2 increases faster than that of bacterial solution with lower concentration. When the urea concentration is greater than 0.6 M, the enzyme activity increases more slowly. When OD600=0.6 or 0.9, it stops increasing and even shows a downward trend at around 0.8 M, among which the downward trend of bacterial solution with OD600=0.6 is relatively obvious. The results are similar to the conclusions drawn by Zhao Qian [8], but the turning point of enzyme activity is slightly different, which may be caused by the different controlled temperature and pH values, while Whiffin [1] concluded that urea has no obvious effect on enzyme activity. Therefore, the urea concentration can be appropriately increased to enhance the urease activity during the experiment, but it should not be too high.
3.2 Sodium chloride concentration
Since sodium chloride is a commonly used salt, the effect of sodium chloride on urease activity should be studied to determine whether the addition of sodium chloride will affect the bacterial strain. Prepare 54 mL of 0, 0.3, 0.6, 0.9, 1.2, 1.5, and 1.8 M sodium chloride and urea mixed solutions, and the urea concentration is 0.5 M. Add 6 mL of bacterial solution (OD600 is 0.5, 1.0, and 1.5, respectively) to the mixed solution, and measure the conductivity change value within 5 minutes at 30℃. The change of bacterial urease activity under different sodium chloride concentrations is calculated, as shown in Figure 4.
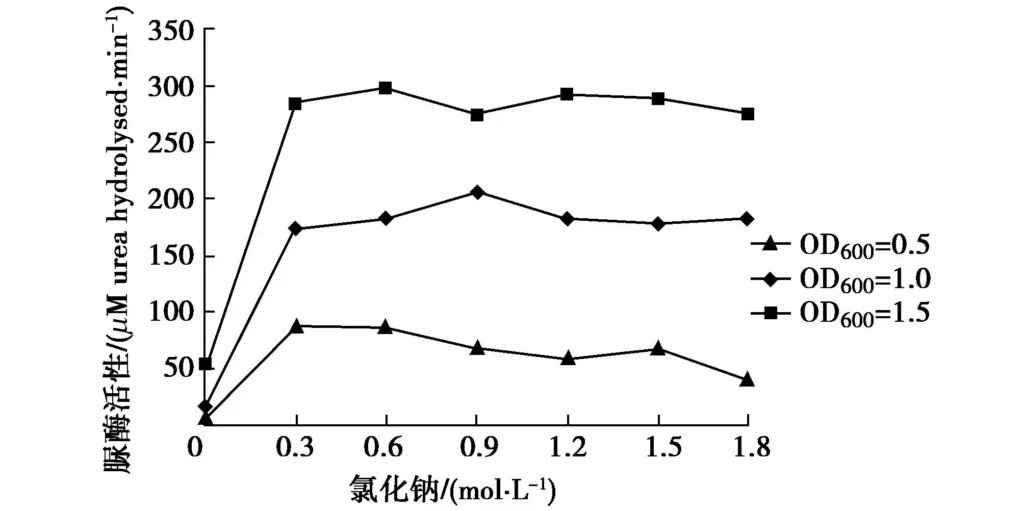
In Figure 4, with the increase of sodium chloride concentration, the bacterial urease activity remains basically stable except for 0 mol/L, so it can be considered that NaCl concentration has no obvious effect on urease activity. Since Na+ and Cl– are both common ions in bacterial culture solutions, this conclusion is consistent with common rules and is also the reason why Whiffin[1] did not consider them as one of the factors affecting urease activity. As for the phenomenon that urease activity is low when no sodium chloride is added, the reason may be that adding a small amount of sodium chloride has a promoting effect on urease activity, or it may be that adding sodium chloride increases the measured conductivity by 1 to 2 orders of magnitude, resulting in an order of magnitude difference in the calculated urease activity, and the result is too small when no sodium chloride is added.
3.3 Acetate concentration
Since calcium acetate and magnesium acetate are required for the subsequent MICP reaction, the effect of acetate on urease activity was studied. Sodium acetate solution was prepared using the same method as the study of the effect of sodium chloride concentration, and the conductivity change within 5 minutes was measured. The change in urease activity is shown in Figure 5.
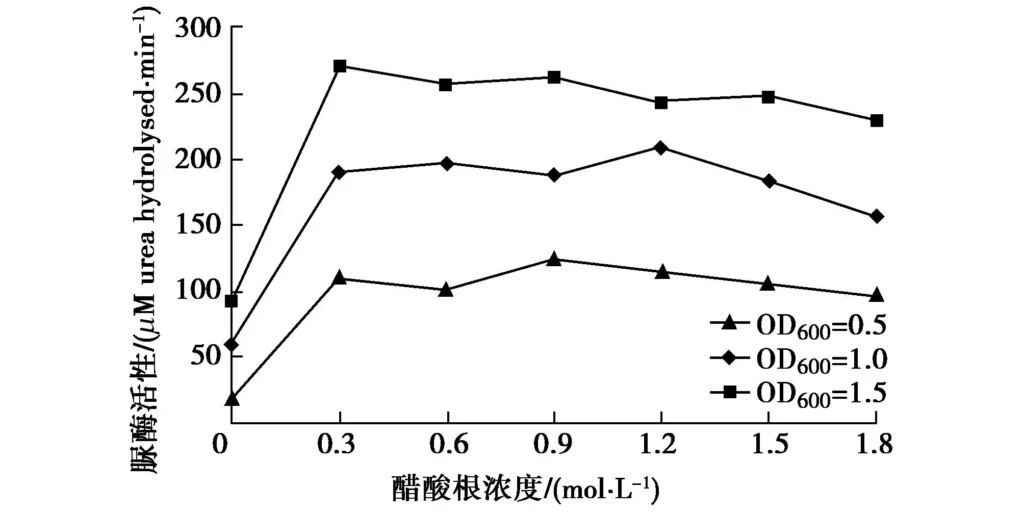
In Figure 5, except for 0 mol/L, the bacterial urease activity decreases slowly with the increase of acetate concentration, which can be considered to remain stable, that is, acetate concentration has no obvious effect on urease activity. When the concentration is 1.8M, the urease activity in all three cases is slightly reduced, which may be because the high salt content in the solution slightly inhibits the bacterial reaction. Therefore, in practical applications, if the concentration of acetic acid is not high, its effect can be ignored, but the concentration should not be too high.
3.4 Ca2+ concentration
Calcium ions provide raw materials for MICP to generate calcium carbonate, so it is necessary to study the effect of calcium ion concentration on urease activity. The calcium chloride and urea mixture and bacterial solution are prepared under the same conditions. Since in the reaction system, Ca2+ and 2CO3- react to generate CaCO3 precipitation, which affects the conductivity, the urease activity is not calculated by measuring the conductivity, but the Berthelot color development principle is used to determine the NH4+-N concentration of 5 min. According to the urea hydrolysis reaction, 1 mol urea hydrolyzes 2 mol NH4+, and the urease activity within 5 min can also be calculated. The change of bacterial urease activity with Ca2+ concentration is shown in Figure 6.
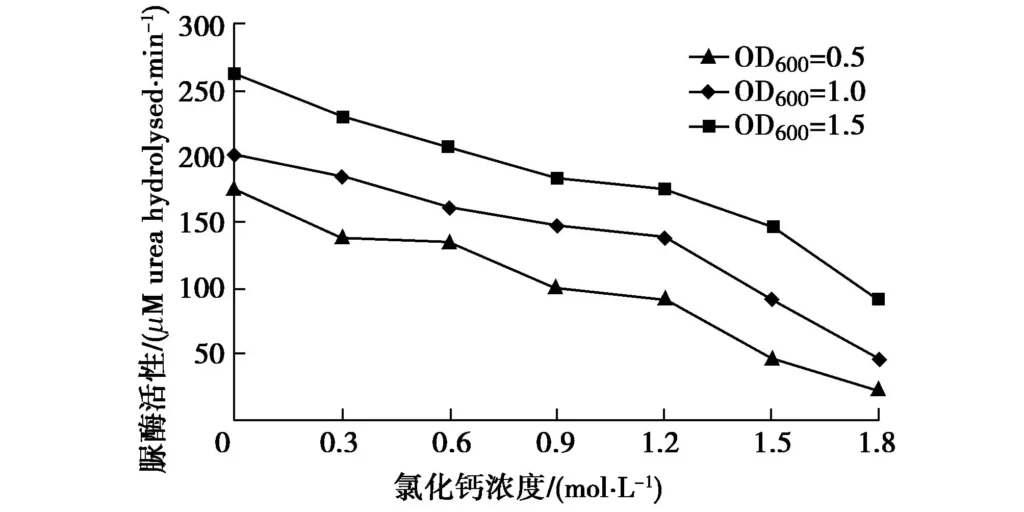
In Figure 6, the activity of urease decreased significantly with the increase of CaCl2 concentration in bacterial solution of different concentrations, and it decreased almost linearly. Therefore, high concentration of CaCl2 had a significant inhibitory effect on urease. When the concentration of CaCl2 was 1.2 M, the activity of urease decreased by nearly one third. When the concentration of CaCl2 increased to 1.8 M, the activity of urease decreased by almost half. Since Nacl had no significant effect on urease activity, but CaCl2 had a significant inhibitory effect, it can be inferred that Ca2+ had an inhibitory effect on enzyme activity. The conclusions are similar to those obtained by Whiffin[1], Zhao Qian[8] and Zhang Yue[11], except that Whiffin[1] used Ca(NO3)2 solution, Zhao Qian[8] proposed that when the CaCl2 concentration was 1.0 M, the urease activity decreased by 35%, and when the CaCl2 concentration increased to 2.0 M, the urease activity decreased by 80%, while Zhang Yue[11] observed that when the calcium salt concentration increased from 0.5 M to 0.75 M, the urease activity increased slightly. Therefore, the Ca2+ concentration needs to be controlled during the experiment, otherwise the precipitation of calcium carbonate will not increase but be inhibited.
3.5 Mg2+ concentration
Magnesium ions provide raw materials for the formation of magnesium carbonate precipitation. The effect of Mg2+ concentration was studied in the same way as the effect of Ca2+ concentration. The change of bacterial urease activity with Mg2+ concentration is shown in Figure 7.
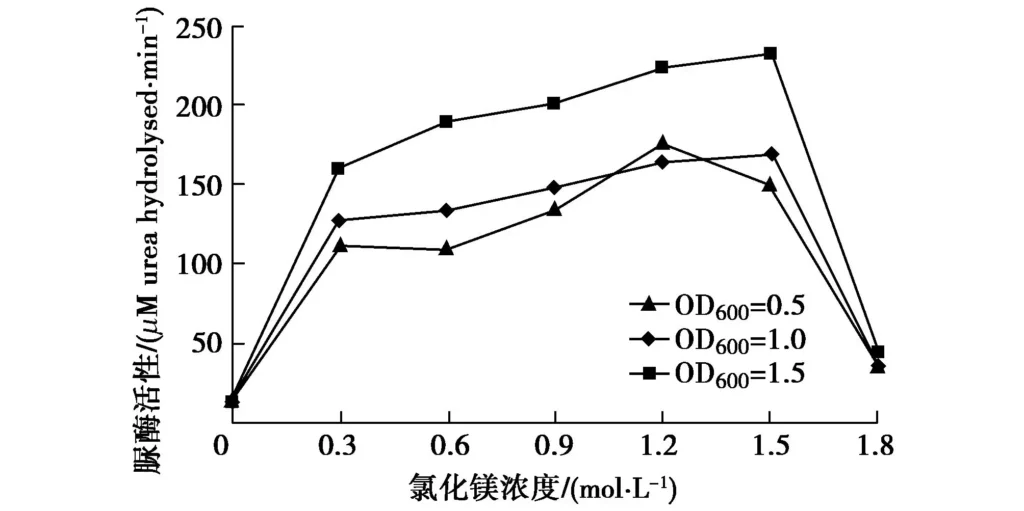
In Figure 7, under different bacterial solution concentration conditions, except for the obvious inhibitory effect of high concentration MgCl2 on urease, the urease activity increased with the increase of MgCl2 concentration. When the OD600 of the bacterial solution was 1.5, the increase of urease activity was more obvious. Therefore, it can be concluded that Mg2+ has a promoting effect on urease activity, but when the MgCl2 concentration is very high, urease is obviously inhibited. This may be because when the concentration is high, one unit of Mg2+ is for two units of Cl-, and the salt content in the solution is too large to inhibit the reaction of the bacteria. Therefore, the concentration of magnesium salt selected for the experiment should be controlled appropriately.
4 Comparison of calcium and magnesium precipitation generation efficiency
4.1 Effect of temperature
Control different temperatures and use calcium acetate and magnesium acetate as two raw materials for generating precipitation for comparative study. The pH value was controlled to be 7, the concentrations of calcium acetate, magnesium acetate and urea were all 0.5 M, and the OD600 of the bacterial solution was 1.01. 5 mL of bacterial solution was added to 45 mL of the mixed solution, and the precipitate mass was weighed and the yield was calculated after 2, 4, and 6 d respectively, as shown in Table 1.
| raw material | Time/d | Different temperature/% | ||
| 20°C | 25°C | 30°C | ||
| Calcium acetate | 2 | 9.5 | 9.5 | 22.3 |
| 4 | 11.8 | 12.3 | 23.6 | |
| 6 | 14.9 | 17.8 | 25.4 | |
| Magnesium acetate | 2 | – | – | – |
| 4 | 1.1 | 3.7 | 5.9 | |
| 6 | 7.3 | 11.2 | 13.3 | |
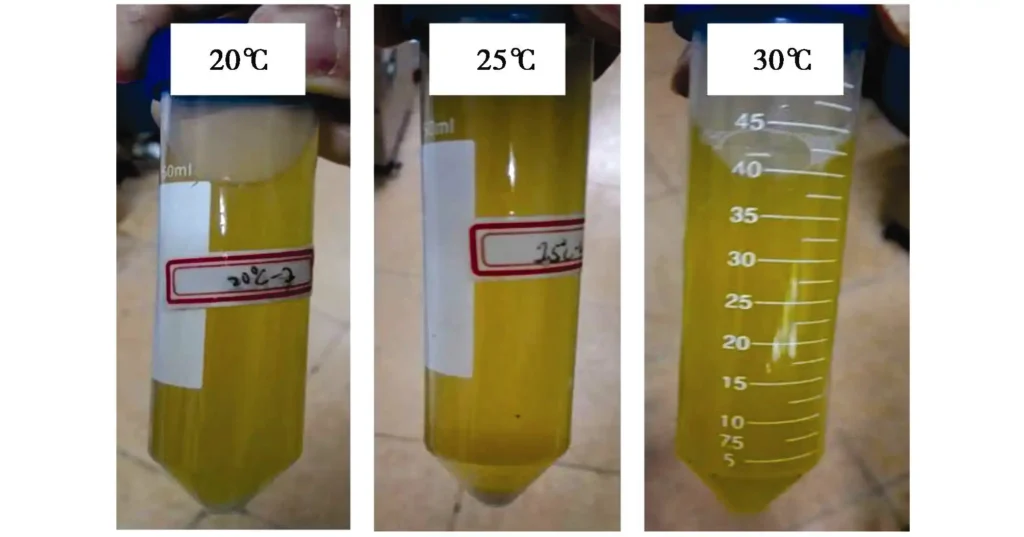
By observing Table 1, it can be seen that when magnesium acetate is used as the raw material for precipitation generation, under the same conditions, the yield of magnesium carbonate is significantly lower than that of calcium carbonate, especially when the temperature is 30℃, the yield of calcium carbonate is as high as 85.2%, while the yield of magnesium carbonate is only 37.3%. One reason is that the solubility of magnesium carbonate and calcium carbonate is about 1×10⁻² and 1×10⁻³, respectively, which is an order of magnitude different from each other. This also explains the phenomenon that almost no precipitation is observed in the sample added with magnesium acetate on the second day, as shown in Figure 8. Another reason is that magnesium carbonate will undergo a small amount of hydrolysis to generate magnesium hydroxide, and the mass of magnesium hydroxide with the same amount of substance is significantly lower than that of calcium carbonate.
4.2 Effect of pH value and ion concentration
It can be seen from the above that under different temperature conditions, the yield of magnesium carbonate is significantly lower than that of calcium carbonate. In order to prevent other specific conditions from obtaining different comparison results, the pH value and ion concentration are controlled. The pH values are set to 6, 7, 8, and 9 respectively. Since Ca2+ and Mg2+ are both divalent ions,
the concentrations of magnesium acetate and calcium acetate are uniformly set to 0.5, 1.0, and 1.5 M. The control temperature is 30℃, the urea concentration is 0.5 M, and the bacterial solution OD600 is 1.23. The precipitation yield after 6 days is obtained by the same method, as shown in Table 2.
It can be seen from Table 2 that under different conditions, the calcium carbonate precipitate generated is significantly more than the magnesium carbonate precipitate, and the reason is also due to the difference in solubility. When the ion concentration is the same, the yields of calcium carbonate and magnesium carbonate precipitation obtained at pH 7 and 8 are significantly greater than those in the other two cases. The difference is that the most suitable pH for the formation of calcium carbonate is 7, which is different from the conclusion of Wang Ruixing [12] that the pH is 8, while the most suitable pH for the formation of magnesium carbonate is 8.
When the pH value is the same, the ion concentration of 1.5 M produces the most precipitation, and the least under the condition of 0.5 M. However, it should be noted that when the ion concentration is 1.0 M and 1.5 M, the magnesium acetate solution cannot be completely dissolved and turbidity appears. Therefore, although there is a lot of precipitation, it is a mixture of magnesium carbonate and magnesium hydroxide. Therefore, the subsequent precipitation tests all use pH 7 and ion concentration of 0.5 M.
| raw material | PH value | Different ion concentration/% | ||
| 0.5 M | 1 M | 1.5 M | ||
| Calcium acetate | 6 | 22.1 | 28.1 | 35.7 |
| 7 | 27.4 | 33.3 | 41.5 | |
| 8 | 26.3 | 32.9 | 40.4 | |
| 9 | 23.3 | 28.6 | 37.9 | |
| Magnesium acetate | 6 | 11.2 | 20.5 | 27 |
| 7 | 15.2 | 25.9 | 33.4 | |
| 8 | 17.4 | 27.3 | 36.5 | |
| 9 | 13.7 | 21.4 | 30.2 | |
5 Comparison of magnesium carbonate precipitation with different urea addition amounts
The main purpose of microbial induced magnesium carbonate precipitation is to solidify sand, but compared with calcium carbonate precipitation, the amount of magnesium carbonate precipitation is much smaller. Therefore, urea is added to the bacterial culture medium, so that the urea is first decomposed into 2 CO3 and then combined with Mg2+ to form precipitation, that is, the biological precipitation is converted into chemical precipitation to accelerate the formation of magnesium precipitation.
By controlling different urea concentrations and using magnesium acetate as the precipitation raw material, the precipitation yield under different temperature conditions was studied. The pH value was controlled to be 7, and the concentrations of magnesium acetate and urea were both 0.5 M. In order to control the influencing factor of bacterial solution concentration and ensure that the bacterial solution concentration was similar to that used in the above calcium-magnesium precipitation comparison test, a bacterial solution with an OD600 of 0.98 was selected, and 5 mL of bacterial solution was added to 45 mL of the mixed solution. The precipitation mass was weighed and the yield was calculated after measuring 1, 2, and 3 days, respectively, as shown in Table 3.
| Urea concentration | Time/d | Different temperature/% | ||
| 20℃ | 25℃ | 30℃ | ||
| 0 g/L | 2 | — | — | — |
| 4 | 1 | 3.1 | 4.5 | |
| 6 | 6.3 | 11.8 | 12.2 | |
| 10 g/L | 2 | 9.4 | 10.1 | 17.4 |
| 4 | 10.7 | 11.3 | 18.2 | |
| 6 | 12.6 | 14.5 | 27.5 | |
| 20 g/L | 2 | 12.3 | 14.5 | 19.9 |
| 4 | 14.8 | 15.2 | 21.7 | |
| 6 | 17.6 | 19.1 | 28.4 | |
By observing Table 3, it can be seen that when urea is added to the bacterial solution, as the bacteria grow and multiply, urea is decomposed to generate 2 CO3-. At this time, when the bacterial solution is added to the mixed solution, a large amount of magnesium precipitate is quickly generated. Therefore, regardless of whether the urea addition amount is 10 g/L or 20 g/L, the precipitation yield on the first day is significantly improved. After that, the bacteria continue to decompose the urea in the gelling liquid to generate more precipitate. When the temperature is the same, the greater the amount of urea added, the more precipitate is generated. And the amount of precipitation generated at a temperature of 30℃ is significantly the largest.
Through the experiment, it is concluded that by adding urea to the bacterial solution, the formation of magnesium carbonate precipitation can be significantly promoted. Therefore, using this method to conduct sand solidification experiments can solve the problem of insufficient magnesium carbonate precipitation and inability to fully solidify.
6 Comparison of the solidification effects of calcium carbonate and magnesium carbonate
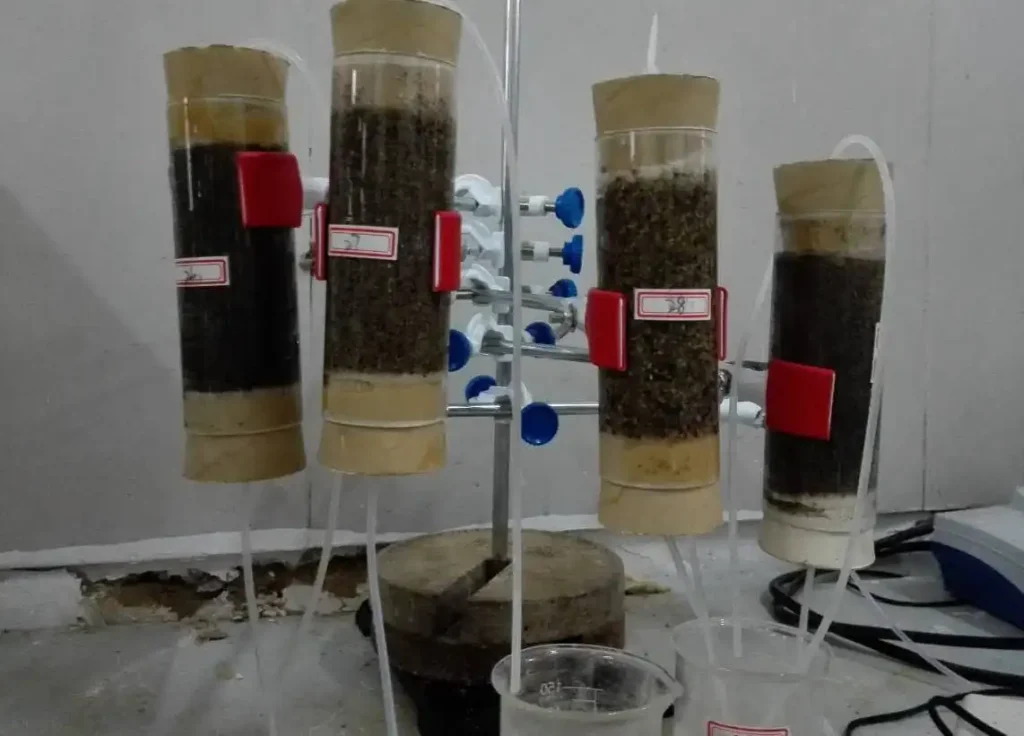
The particle size of the experimental sand is less than 0.25 mm. 210 g of sand (poorly graded river sand dried at 110°C) was weighed and placed in a PVC tube (inner diameter 46 mm, outer diameter 50 mm). The height of the sand sample was about 11 cm, that is, the initial dry density was about 1.57 g/cm3. Two gelling liquids were used in the sand solidification test, namely calcium acetate and magnesium acetate. Calcium acetate was used because calcium acetate can be used to solidify sand columns with higher uniformity than calcium chloride and calcium nitrate [13].
Each case is divided into two types: adding urea (20 g/L) after sterilization of the culture medium and adding no urea. The test temperature was 30°C, and the pH value of the bacterial solution and the gelling liquid was controlled to 7.
The bacterial solution cultured for 48 h was poured into the PVC tube at a rate of 4 mL/min until obvious bacterial solution flowed out. After standing for 2 h, 150 mL of gelling liquid (a mixture of 0.5 mol/L urea and calcium acetate/magnesium acetate) was injected at a flow rate of 4 mL/min, and then it was left to stand for about 20 h before the next cycle. The above steps were repeated once a day, and bidirectional curing was performed by forward and reverse perfusion. The curing was completed after 10 days of curing. The sand column was then subjected to an unconfined compression test, as shown in Figure 9, and the obtained strength is shown in Table 4.
| Sample | Urea addition method | Gel | Unconfined compressive strength/MPa |
| 1 | Add urea | Calcium acetate | 0.32 |
| 2 | Without urea | Calcium acetate | 0.58 |
| 3 | Add urea | Magnesium acetate | 0.65 |
| 4 | Without urea | Magnesium acetate | — |
By comparing Table 4, it is found that in the magnesium acetate solidification test, adding urea to the bacterial culture fluid can make the sand solidify and have a certain strength, as shown in Figure 10, and the strength is slightly higher than that of the calcium acetate solidified sand column in both cases. However, due to the small amount of precipitation, the sand cannot be completely solidified in the magnesium acetate solidified sand sample without adding urea, and the sand is broken, as shown in Figure 11. However, it should be noted that when urea is not added, the strength of the calcium acetate sample is higher than that of the sample with urea. This is because the sample length is longer and the sample pores are smaller. In the case of bidirectional perfusion, a large amount of solidification reaction occurs at both ends of the sample, making the two ends solidified significantly. In the middle part far away from the two ends, the solidification reaction is significantly reduced, so the overall strength is smaller. However, the strength of the two ends of the sand column is significantly higher than that of the middle part, which also confirms that the method of adding urea can promote the solidification of sand.
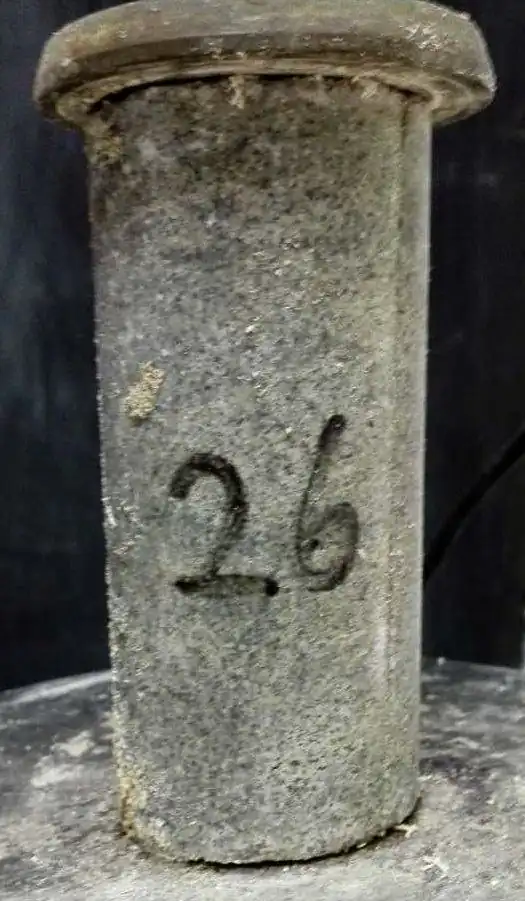
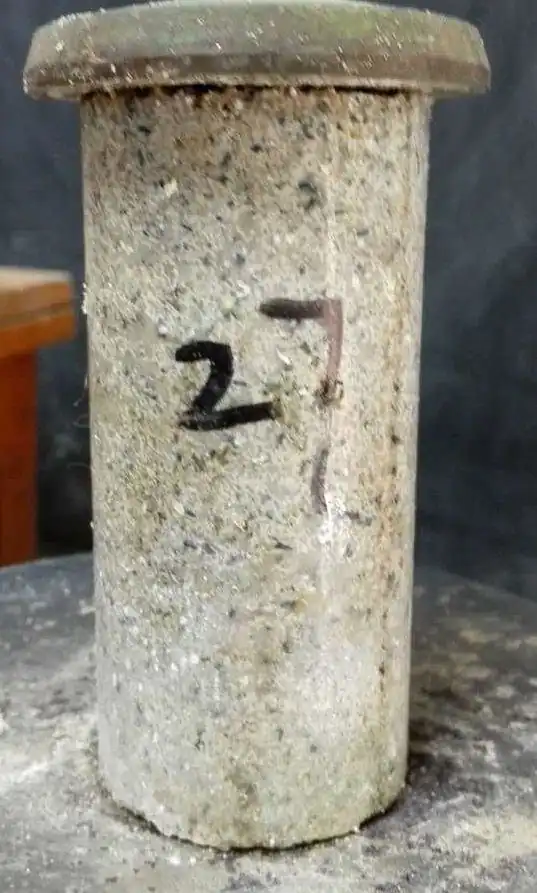
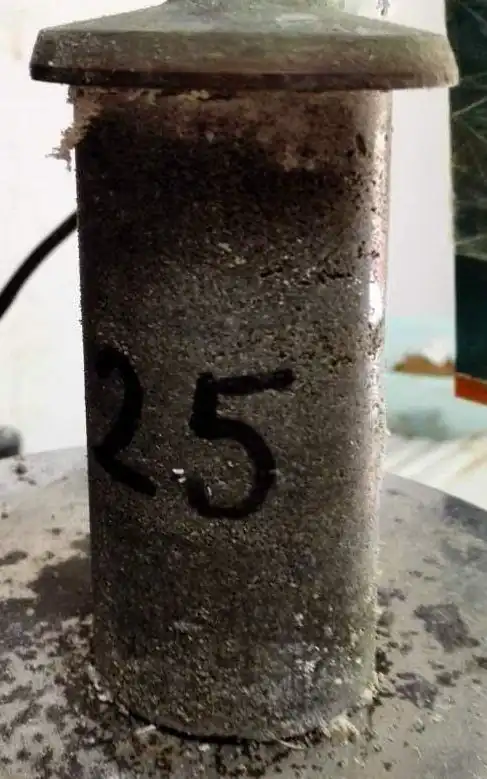
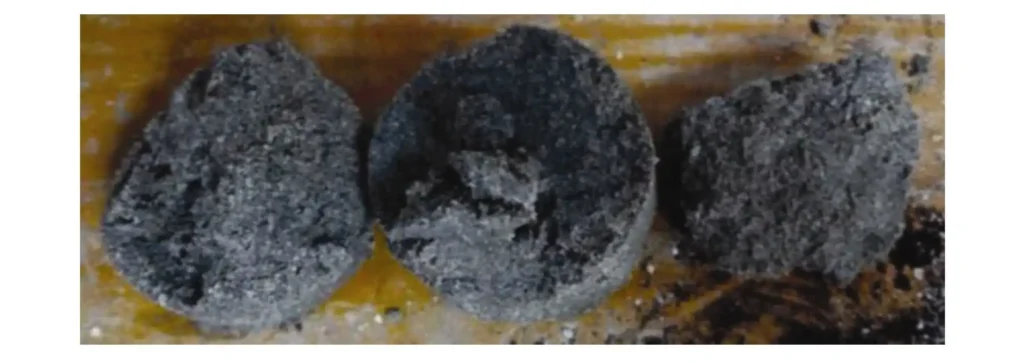
Therefore, it is feasible to use microorganisms to induce magnesium precipitation to solidify sand in the case of adding urea, and the strength is slightly greater than that of calcium carbonate solidification. As for the effect of different urea concentrations on the effect of magnesium precipitation solidification of sand, further research is needed.
7 Conclusion
This paper analyzes the influence of various factors on urease activity, and compares the precipitation rate of calcium carbonate and magnesium carbonate and the effect of sand solidification, providing important reference for subsequent research, and draws the following 4 conclusions.
(1) Appropriately increasing the concentration of urea and Mg2+ can enhance the activity of bacterial urease, but the concentration should not be too high. The concentration of sodium chloride and the concentration of acetic acid have no significant effect on the activity of urease. The concentration of Ca2+ has a significant inhibitory effect on the activity of urease.
(2) Under the same conditions of temperature, pH value and ion concentration, the precipitation yield of magnesium carbonate is significantly lower than that of calcium carbonate. The higher the temperature, the greater the precipitation yield of calcium and magnesium. The two precipitation yields obtained at pH values of 7 and 8 are larger, and the higher the ion concentration, the more precipitation. When the ion concentration is 1.0 and 1.5 M, the precipitate may be a mixture of magnesium carbonate and magnesium hydroxide. Therefore, the subsequent precipitation experiments all use a pH value of 7 and an ion concentration of 0.5 M.
(3) By adding urea to the bacterial solution, the formation of precipitation can be significantly promoted. Under the same temperature, pH value and ion concentration conditions, the higher the concentration of urea added, the greater the yield of magnesium carbonate.
(4) Adding urea to the bacterial culture solution can make the magnesium carbonate-solidified sand form and have a certain strength, which is slightly greater than that of calcium carbonate solidification. Therefore, the method of adding urea can solve the problem of insufficient magnesium carbonate precipitation in the sand solidification test and inability to fully solidify.
