Abstract: A high specific surface area mesoporous MgO was prepared by a simple method of “calcination-hydration-calcination” using natural hydromagnesite as raw material, and no reagents were added during the experiment. The effects of magnesium oxide dosage, adsorption time, adsorption temperature and pH on the adsorption performance of lead ions in simulated wastewater by magnesium oxide were systematically studied, the adsorption mechanism was revealed, and the adsorption effect of magnesium oxide on various ions was investigated. The results showed that the magnesium oxide adsorbent had a high specific surface area of 188 m2·g-1 and a high pore volume of 0.85 cm3·g-1, with an average pore size of 12.33 nm. Its adsorption kinetics and isotherm data were highly consistent with the pseudo-second-order model and Langmuir model, indicating that heavy metal ions were chemically adsorbed on magnesium oxide in a single layer. The mesoporous MgO structure showed high adsorption performance for Pb (Ⅱ), with a maximum adsorption capacity of 7 431.5 mg·g-1, which was much higher than that of other reported MgO-based adsorbents, and the lead removal rate was as high as 99.8%. The adsorption mechanism of mesoporous MgO is mainly due to the ion exchange between hydroxyl functional groups and Mg (II) and heavy metal ions on the surface of MgO. In addition, the magnesium oxide can adsorb multiple ions at the same time, and has excellent adsorption performance for Cd, Cr, Ni, As, Co, P, Se, Be, Bi, Cu, Fe, Mn, V, Zn, and Al ions.
Introduction
In the past few decades, due to human activities such as urbanization, industrialization, and agricultural practices, a large amount of waste has been discharged into the environment and water resources, causing serious water pollution. Water pollution and increased water demand are leading to serious water shortage problems worldwide, and recycled wastewater is one of the important solutions [1]. Heavy metal ions such as Pb (II), Cd (II), Ni (II), Cr (II), As (II), Zn (II), and Cu (II) are very harmful pollutants in water. The high toxicity, persistence in the environment, non-biodegradability, and bioaccumulation of these ions have posed a serious threat to public health and ecosystems [2-3]. Therefore, the effective removal of heavy metal ions from water systems is of great significance for the reuse of wastewater and the protection of the earth’s ecosystem. To date, a variety of heavy metal ion removal methods have been developed, such as chemical precipitation[4], coagulation/flocculation[5], adsorption[6], ion exchange[7], membrane filtration[8], electrochemical treatment[9], flotation[10] and microbial system treatment[11]. Among them, adsorption technology is recommended by researchers due to its simple and stable treatment process, no secondary pollution, high efficiency and low cost. According to literature reports, various adsorbents such as activated carbon[12], metal oxides[13], magnetite[14], chitosan[15], zeolite[16], etc. have been used to remove heavy metal ions such as cadmium and lead from aqueous solutions. However, the adsorption capacity and removal efficiency of these adsorbents are generally low. Therefore, finding efficient adsorbents for removing heavy metal ions is an important research direction at present.
In recent years, some metal oxides or metal hydroxides have attracted people’s attention due to their low cost, green environmental protection and excellent adsorption performance. Among them, magnesium oxide (MgO) has the characteristics of large specific surface area, rich pore structure, many surface active sites, strong adsorption capacity and wide application range, and has become one of the most promising metal oxide adsorbents for treating water pollutants [17]. For example, Cao et al. [18] used magnesium nitrate and urea as raw materials and ethanol as solvent to prepare flower-like MgO with high specific surface area by microwave-assisted solvothermal method, and showed excellent removal efficiency for Pb and Cd, with maximum adsorption amounts of 1980 and 1500 mg·g-1, respectively. They also proposed the adsorption mechanism of cation exchange between Mg ions from MgO and Pb or Cd. Xiong et al. [19] prepared MgO nanoparticles by sol-gel method for the removal of Cd and Pb from aqueous solution (maximum adsorption amounts of 2294 and 2614 mg·g-1, respectively), and studied the competitive adsorption of the two ions. The results showed that the adsorption priority was Pb > Cd. Feng et al. [20] prepared hexagonal mesoporous MgO nanosheets with a specific surface area of up to 182 m2·g-1, which were used to remove Ni from aqueous solutions with a maximum adsorption capacity of 1 684.25 mg·g-1. On this basis, the study of magnesium oxide adsorbents with higher adsorption performance, lower preparation cost and difficulty has great research value and economic significance.
Based on this, this paper reports a method for preparing mesoporous reticular magnesium oxide using abundant natural hydromagnesite as raw material. Generally, the mesoporous reticular structure has rich pore structure, high specific surface area, and can provide a large number of surface active sites. It is an excellent structure with good adsorption characteristics. Therefore, in order to verify whether magnesium oxide with this special structure has excellent adsorption performance, we took Pb(Ⅱ) as an example and systematically studied the effects of magnesium oxide dosage, adsorption time, adsorption temperature and pH on the adsorption performance and adsorption mechanism of magnesium oxide adsorbent on lead ions in simulated wastewater, and investigated the adsorption effect of magnesium oxide adsorbent on multi-component ions in solution.
1. Experimental part
1.1 Experimental materials
Natural hydromagnesite (Mg(OH)2·4MgCO3·4H2O) was obtained from Bange Lake, Tibet. Pb(NO3)2, HNO3, NaOH and anhydrous ethanol (analytical grade) were purchased from Sinopharm Chemical Reagent Co., Ltd. (Shanghai). Deionized water was prepared in the laboratory. 24 ions (Al, As, B, Ba, Be, Bi, Ca, Cd, Co, Cr, Cu, Fe, K, Li, Mg, Mn, Na, Ni, P, Pb, Se, Sr, V, Zn) were prepared into a 1 000 mg·L-1 mixed standard solution for standby use. All reagents can be used without further purification.
1.2 Preparation of high specific surface area mesoporous magnesium oxide adsorption material
Put an appropriate amount of hydromagnesite in a crucible and calcine it in a muffle furnace. The parameters were set as follows: calcination temperature 650 ℃, calcination time 30 min, and heating rate 10 ℃·min-1. After cooling to room temperature, grind it into powder and sieve it with a 200-mesh sieve to obtain magnesium oxide. Add deionized water to a three-hole flask and heat it to 80 °C. Weigh a certain amount of prepared magnesium oxide and slowly add it to the water under vigorous stirring, keeping the solid-liquid ratio (mass ratio) at 1:30, and reflux in a water bath for 2 h. After the reaction, the suspension was aged for 30 min, filtered and washed. The filter cake was placed in a 150 °C forced air drying oven and dried for 3 h, and ground to obtain white magnesium hydroxide powder. The magnesium hydroxide powder was then calcined again at 650 °C (heating rate 10 °C·min-1) for 1 h to obtain magnesium oxide adsorbent powder.
1.3 Adsorption experiment of magnesium oxide on Pb(Ⅱ)
In the single ion simulated water sample, Pb(NO3)2 was used as the heavy metal ion source to prepare different concentrations of lead ion solutions with pH=6; the mixed ion simulated water sample used the mixed standard solution as the mixed ion source and diluted it to a concentration of 40 mg·L-1 for each ion and pH=2. The pH of the stock solution was adjusted using NaOH (0.1 mol·L-1) and HNO3 (0.1 mol·L-1).
20 mL of a certain concentration of Pb(Ⅱ) or mixed ion simulated water sample was transferred into a 100 mL beaker, and a certain amount of the magnesium oxide adsorbent prepared above was added. The reaction was stirred in a magnetic stirrer at a set temperature for a period of time. After the reaction was completed, the solution was filtered and separated, and the clear liquid was taken to detect the lead ion concentration and the pH value of the effluent. The filtrate was adjusted to pH < 9 and then discharged. The obtained precipitate was dried at 50 °C, and the phase changes were analyzed by X-ray diffractometer.
The calculation formula (1) of ion removal rate (R) is: R = (c0-ce)/c0× 100%, and the calculation formula (2) of adsorption equilibrium (qe) is: qe = (c0-ce)V/m, where c0 is the initial concentration of Pb(Ⅱ) (mg·L-1), ce is the equilibrium concentration of Pb(Ⅱ) (mg·L-1), V is the volume of solution (L), and m is the mass of adsorbent (g).
1.4 Characterization and test methods
Phase analysis was performed using an X-ray powder diffractometer (Rigaku, Japan), with the following parameters: Cu Kα radiation, λ=0.154 18 nm, nickel filter, 25 mA, 35 kV, scan rate 30 (°)·min-1, and scan range 10°~90°. The thermal decomposition process of hydromagnesite was analyzed by a differential thermal gravimetric analyzer (TGA/SDTA851e) (Mettler-Toledo Instruments, Switzerland). The parameters were as follows: temperature range: room temperature to 800 °C, heating rate 10 °C·min-1, N2 atmosphere. The morphology and structure of the product were observed by a Quanta FEG 250 field emission scanning electron microscope (FEI, USA), and gold treatment was performed before the measurement. The N2 adsorption-desorption isotherm of the sample was measured by a gas adsorption analyzer to obtain the specific surface area, pore volume and pore size distribution (model: Autosorb-IQ); the concentration of lead ions and other ions remaining in the solution after adsorption was determined by an inductively coupled plasma atomic emission spectrometer (USA, model: icap7200 Radial).
2. Results and discussion
2.1 Analysis of hydromagnesite raw materials
The XRD pattern of natural hydromagnesite is shown in Figure 1a. The main mineral components are hydromagnesite (Mg(OH)2·4MgCO3·4H2O) and aragonite (CaCO3). Chemical analysis of the sample showed that the mass fraction of magnesium oxide was 41.59%, the mass fraction of calcium oxide was 1.30%, and the content of other impurities was relatively small.
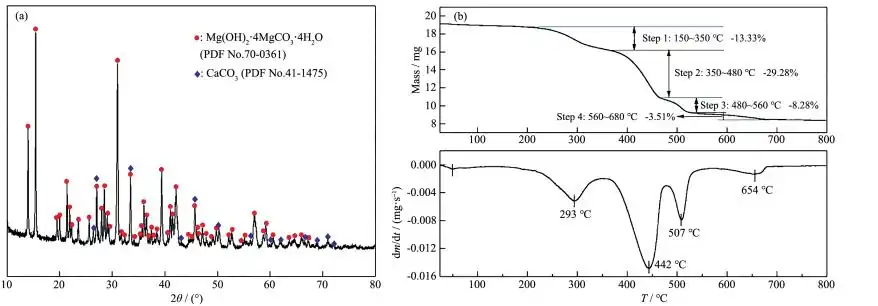
Hydromagnesite (Mg(OH)2·4MgCO3·4H2O) was thermally decomposed in a nitrogen atmosphere at 800 °C to obtain the TG-DTG curve shown in Figure 1b. The TG curve shows that the initial decomposition temperature of the sample is around 150 °C, and the temperature of complete decomposition is around 680 °C. According to the mass loss steps of the TG curve, the mass loss process of the sample decomposition can be divided into four intervals: 150~350 °C, 350~480 °C, 480~560 °C, and 560~680 °C. It can be seen from the DTG curve that the mass loss rate in each stage is different. The mass losses in the four temperature intervals are 13.33%, 29.28%, 8.28% and 3.51% respectively, and the total decomposition rate is 54.40%. The endothermic reactions that may occur in each interval [21] are as follows:
150∼350℃:Mg(OH)2⋅4MgCO3⋅4H2O→Mg(OH)2⋅4MgCO3+4H2O (3)
350∼480℃:Mg(OH)2⋅4MgCO3→4MgCO3+MgO+H2O (4)
480∼560℃:MgCO3→MgO+CO2 (5)
560∼680℃:CaCO3→CaO+CO2 (a small amount of aragonite impurities in the sample decompose) (6)
The equation for the total endothermic reaction decomposition is (7). Therefore, calcination at 650℃ can basically completely decompose hydromagnesite.
Mg(OH)2⋅4MgCO3⋅4H2O→5MgO+4CO2+5H2O (7)
2.2 Analysis and characterization of high specific surface area magnesium oxide
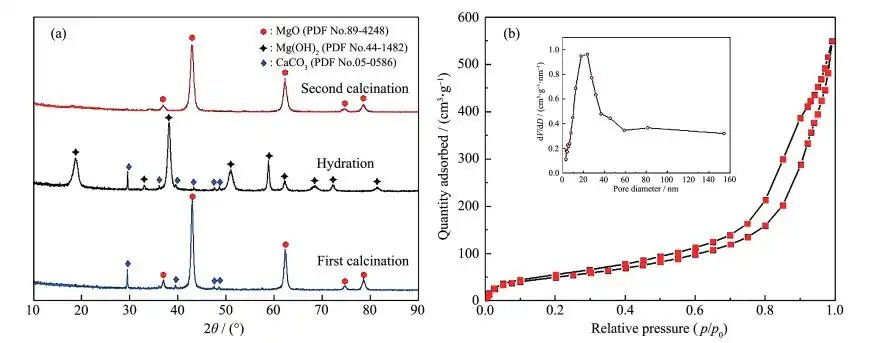
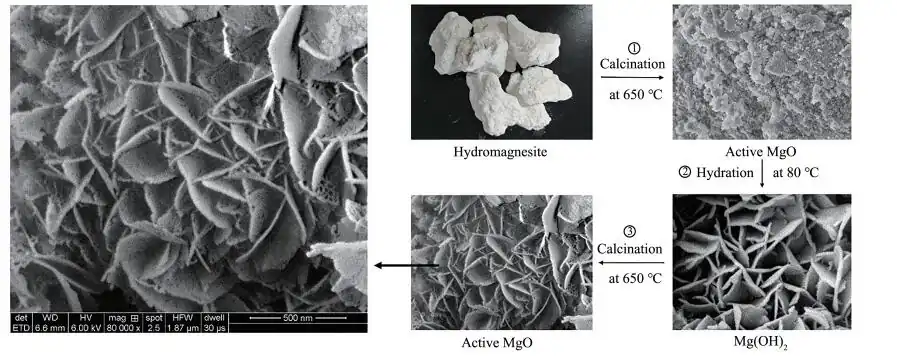
The XRD and SEM images of magnesium oxide prepared by the “calcination-hydration-calcination” route using hydromagnesite as raw material are shown in Figure 2a and Figure 3, respectively. The diffraction peaks of the calcined product are mainly located at 2θ = 36.76°, 42.84°, 62.12°, 74.64°, and 78.14°, which are completely consistent with the peaks of MgO (PDF No. 89 – 4248), indicating that the calcined product is MgO. The diffraction peaks of the hydrated product are mainly located at 2θ = 18.58°, 32.84°, 37.96°, 50.88°, 58.70°, 62.14°, 68.10°, and 72.16°, which are completely consistent with the peaks of Mg(OH)2 (PDF No.44-1482), indicating that the hydrated product is Mg(OH)2. From the XRD comparison of the first and second calcinations, it can be seen that the peak of the product after the first calcination is sharp and has an impurity peak, while the impurity peak of the product after the second calcination disappears and the peak shape is broadened. In addition, based on the half-width (FWHM) of all peaks, the average particle size of the first and second calcinations was determined to be 18.41 and 13.47 nm, respectively, using the Debye-Scherrer[22] equation, proving that the second calcined MgO has higher purity and smaller grain size. As can be seen from Figure 3, the magnesium oxide calcined for the first time has no specific morphology, and the magnesium oxide calcined for the second time presents a flower-like lamellar “net” structure with porosity. The N2 adsorption-desorption isotherm and pore size distribution of magnesium oxide are shown in Figure 2b. The sample exhibits a type IV isotherm with an H3 hysteresis loop, which is mainly seen in mesoporous or macroporous materials with narrow slits in the aggregates of the layered structure, indicating the mesoporous nature of the material[23]. The pore size distribution was calculated using the BJH (Barrette-Joyner-Halendg) model, and the average pore size was 12.33 nm, further proving that the material is a mesoporous structure, which is consistent with the morphology of magnesium oxide seen in the SEM image. The BET (Brunaure-Emmett-Teller) calculation results show that the specific surface area of the magnesium oxide is 188 m2·g-1 and the pore volume is 0.85 cm3·g-1. This porous structure provides a large number of surface active sites, which will be very beneficial in water treatment.
2.3 Effect of various factors on the adsorption of Pb(Ⅱ) by magnesium oxide
2.3.1 Effect of magnesium oxide dosage on Pb(Ⅱ) removal efficiency
The dosage of adsorbent affects the adsorption of heavy metal ions. Too little adsorbent will lead to poor adsorption of heavy metal ions due to insufficient adsorption active sites; while too much adsorbent will increase the treatment cost and even pollute the water quality. In order to determine the optimal dosage of magnesium oxide adsorbent, 20 mL of 100 mg·L-1, pH=6 Pb(Ⅱ) water sample was transferred into a 100 mL beaker, and different amounts (0.005~0.3 g·L-1) of magnesium oxide adsorbent were added, and adsorption experiments were carried out at room temperature. Figure 4 shows the relationship between magnesium oxide dosage and Pb(Ⅱ) removal efficiency, and Table 1 is the specific data. It can be seen that when the dosage of magnesium oxide is increased from 0.005 g·L-1 to 0.05 g·L-1, the removal efficiency of Pb(Ⅱ) jumps from 46.63% to 99.86%; when the dosage is increased from 0.05 g·L-1 to 0.3 g·L-1, no special improvement in efficiency is observed. Therefore, it can be considered that 0.05 g·L-1 is the optimal adsorbent dosage for further experiments.
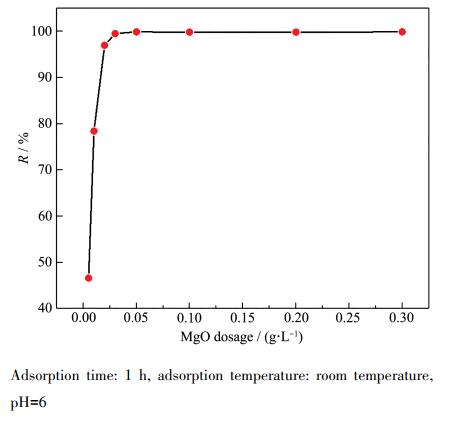
Adsorption time: 1 h, adsorption temperature: room temperature, pH=6

2.3.2 Effect of adsorption time on Pb(Ⅱ) removal efficiency
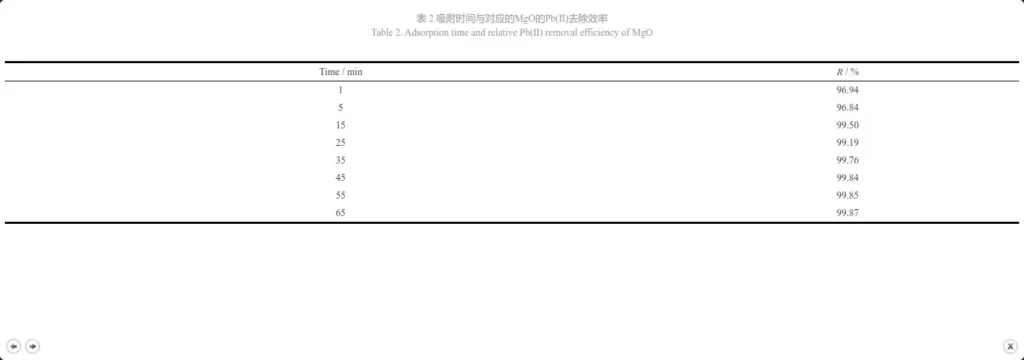
Pipette a series of 100 mg·L-1, pH=6 Pb(Ⅱ) water samples 20 mL into a 100 mL beaker, add 0.05 g·L-1 adsorbent, conduct adsorption experiments at room temperature, and measure the lead ion concentration at regular intervals. The relationship between adsorption time and Pb(Ⅱ) removal efficiency is shown in Figure 5. The specific values are shown in Table 2. It can be seen that the process of MgO adsorbing Pb(Ⅱ) is very fast. The removal efficiency quickly reaches 96.94% within the first 1 min, and the contact time is about 45 min to reach equilibrium, at which time the removal efficiency reaches 99.84%. Such a fast adsorption rate can be attributed to the presence of a large number of active sites on the surface of MgO. Therefore, considering the removal efficiency and time cost, the adsorption time for further experiments is set to 45 min.
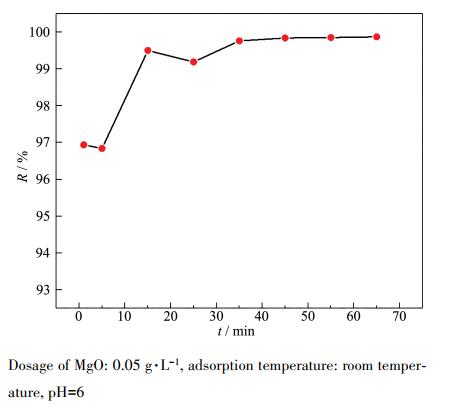
Dosage of MgO: 0.05 g·L-1, adsorption temperature: room temper-ature, pH=6
2.3.3 Effect of adsorption temperature on Pb(Ⅱ) removal efficiency
A series of 100 mg·L-1, pH=6 Pb(Ⅱ) water samples 20 mL were transferred into a 100 mL beaker, 0.05 g·L-1 adsorbent was added, and adsorption experiments were carried out at different temperatures. The relationship between adsorption temperature and Pb(Ⅱ) removal efficiency is shown in Figure 6. It can be seen that, overall, the temperature has little effect on the removal rate. The adsorbent shows excellent adsorption efficiency at room temperature. Therefore, further experiments were selected at room temperature.
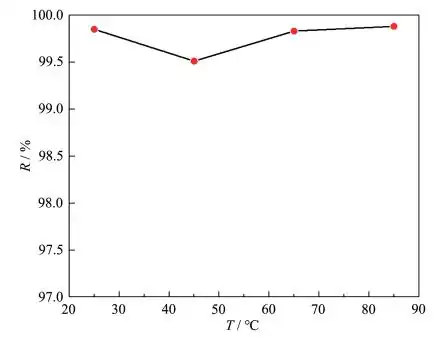
Dosage of MgO: 0.05 g·L-1, adsorption time: 45 min, pH=6
2.3.4 Effect of wastewater solution pH on Pb(Ⅱ) removal efficiency
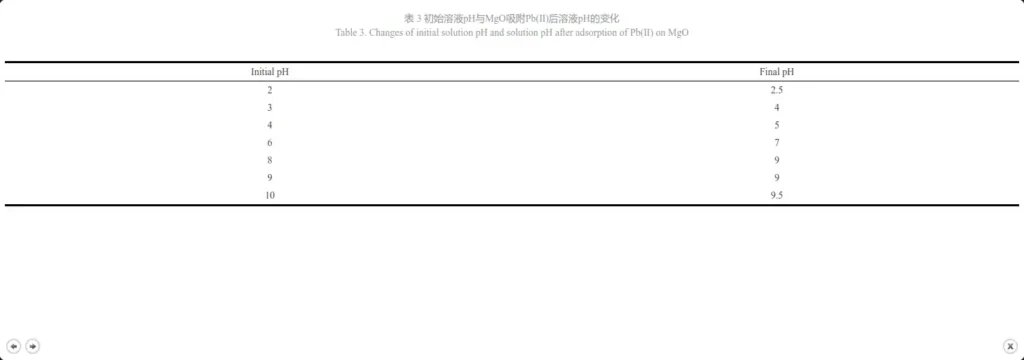
Wastewater is acidic and alkaline, so the pH value of the solution is one of the most important factors in the adsorption process. A series of 100 mg·L-1 Pb(Ⅱ) water samples with different pH values were transferred into a 100 mL beaker, and 0.05 g·L-1 adsorbent was added. The adsorption experiment was carried out at room temperature. Figure 7 shows the effect of different initial solution pH values on Pb(Ⅱ) removal efficiency and the change of Mg2+ concentration in the solution. It is found that with the increase of pH, the removal efficiency increases rapidly. This is because at a lower pH value, the MgO surface will be completely covered by H+ in the solution, which consumes most of the adsorbent, resulting in a decrease in adsorption capacity; but with the increase of pH, the competition from H+ decreases, and the positively charged Pb2+ is adsorbed to the negatively charged position of the adsorbent[24]. Under the condition of pH ≥ 6, the removal efficiency of Pb(Ⅱ) is almost 100%. In addition to part of the adsorption effect, it is also because the excess OH– combines with Pb2+ and Mg2+ to form Pb(OH)2 and Mg(OH)2 precipitation respectively. The decrease in Mg2+ concentration can fully illustrate this point. Under the condition of pH ≤ 8, Pb2+ is dominant; under the condition of pH > 8, the formation of Pb(OH)2 has a greater influence on adsorption [25]. Table 3 shows the pH value of the solution before and after adsorption, indicating that the pH of the solution increases after adsorption. However, under the condition of pH > 9, the Mg2+ concentration will be very low, which will seriously affect the buffering effect of Mg(OH)2 and Mg2+, and then make the effluent pH > 9. Therefore, the appropriate pH value is 6~8. In addition, in acidic wastewater, the pH can be adjusted by increasing the amount of magnesium oxide to improve the adsorption performance.
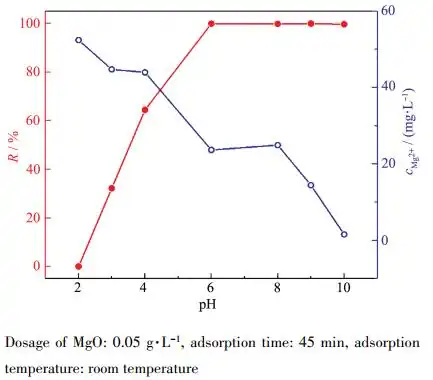
Dosage of MgO: 0.05 g·L-1, adsorption time: 45 min, adsorption temperature: room temperature
2.4 Adsorption kinetics
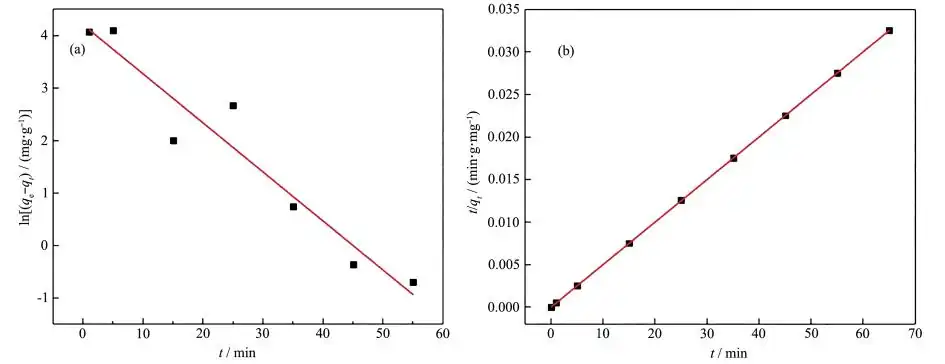
In order to better study the adsorption rate-controlling step and describe the adsorption behavior on the adsorbent, the adsorption kinetic data were analyzed according to Lagergren’s pseudo-first-order kinetics (8) and pseudo-second-order kinetics (9). The pseudo-first-order kinetics model is mainly used to describe the physical adsorption process, and the pseudo-second-order kinetics model is mainly used to describe the chemical adsorption process. Their linear equations [26-27] are as follows:
ln(qe−qt)=lnqe−k1t(8)
t/qt=1/k2qe2+t/qe(9)
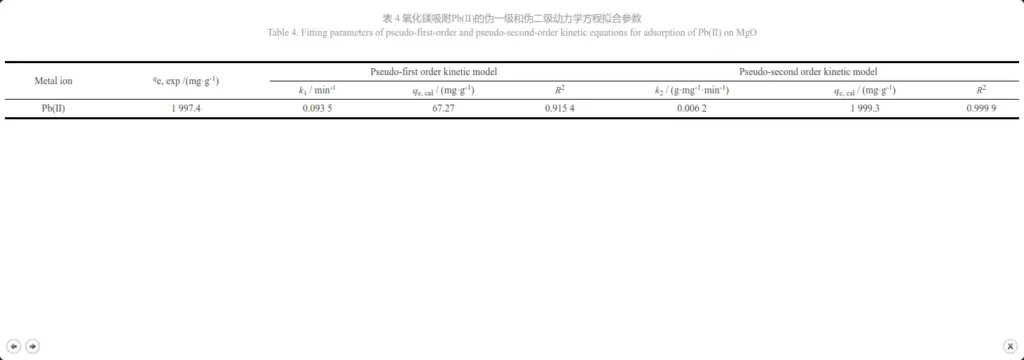
where qe is the equilibrium adsorption capacity (mg·g-1), qt is the adsorption capacity at time t (min) (mg·g-1), k1(min-1) and k2(g·mg-1·min-1) are the adsorption rate constants of the pseudo-first-order model and pseudo-second-order model, respectively. The pseudo-first-order and pseudo-second-order kinetics fitting of the adsorption process of Pb(Ⅱ) by magnesium oxide are shown in Figures 8a and 8b, and the fitting parameters of the two models are shown in Table 4. By comparison, it can be seen that the pseudo-second-order kinetic model fits its adsorption process much better (R2=0.999 9) than the pseudo-first-order kinetic model (R2= 0.915 4), and the qe, cal calculated by the pseudo-second-order kinetic model is comparable to the experimental value (qe, exp). Therefore, it can be concluded that the adsorption process of magnesium oxide on Pb(Ⅱ) conforms to the pseudo-second-order kinetic model, indicating that MgO has a high specific surface area, low internal diffusion resistance, and chemical reaction is the rate-limiting step [26, 28]. It can be said that the most likely mechanism is chemical adsorption involving electron exchange between the adsorbent and the adsorbate [29].
2.5 Adsorption isotherm
In order to study the maximum absorption degree that the adsorbent can achieve during the adsorption process at a certain temperature, the adsorption isotherm is often used to represent the relationship between the equilibrium adsorption amount and concentration. 20 mL of simulated wastewater solution with Pb2+ concentration of 100, 200, 300, 400, 600, 700, and 900 mg·L-1 was respectively transferred into a beaker, and an equal volume of 0.05 g·L-1 magnesium oxide adsorbent was added, and the adsorption experiment was carried out at room temperature. Figure 9 shows the adsorption isotherm obtained. The results show that the adsorption amount of Pb(Ⅱ) gradually increases with the increase of metal ion concentration until the maximum absorption occurs.
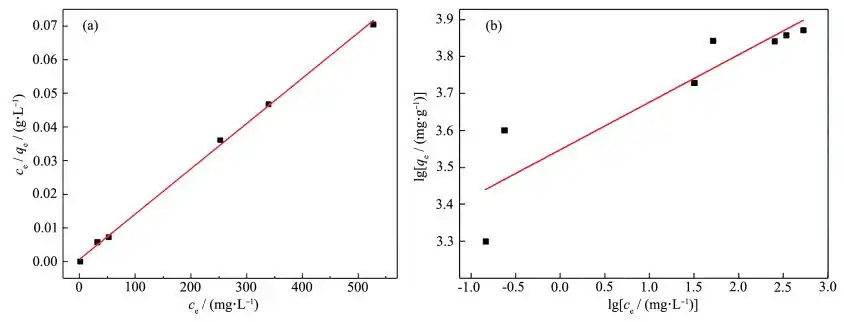
We use the commonly used Langmuir (10) and Freundlich (11) isotherm models to explain the adsorption equilibrium. The Langmuir model proposes monolayer adsorption, while the Freundlich model proposes multilayer adsorption[30]. Their linear equations are as follows:
ce/qe=1/qmb+ce/qm (10)
lgqe=(1/n)lgce+lgkf (11)
Wherein, qe is the equilibrium adsorption amount (mg·g-1), ce is the solution equilibrium concentration (mg·L-1), qm is the maximum adsorption amount of the adsorbent (mg·g-1), b is the adsorption equilibrium constant (L·mg-1); Kf is a constant related to the adsorption capacity (mg1-1/n·L1/n·g-1), and n is an empirical parameter related to the adsorption intensity.
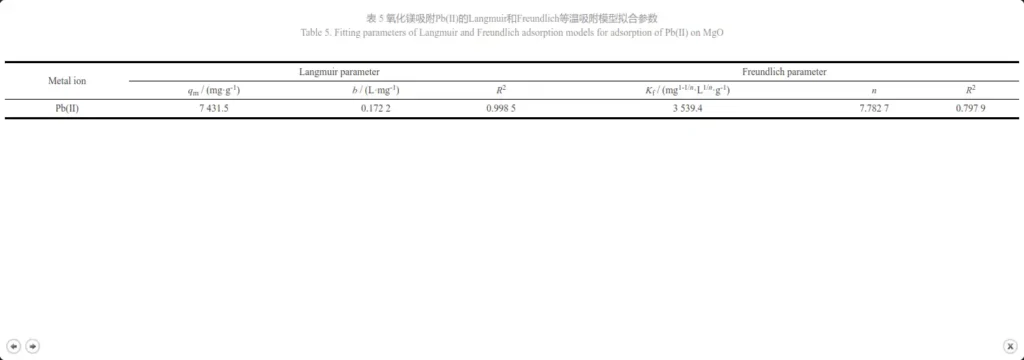
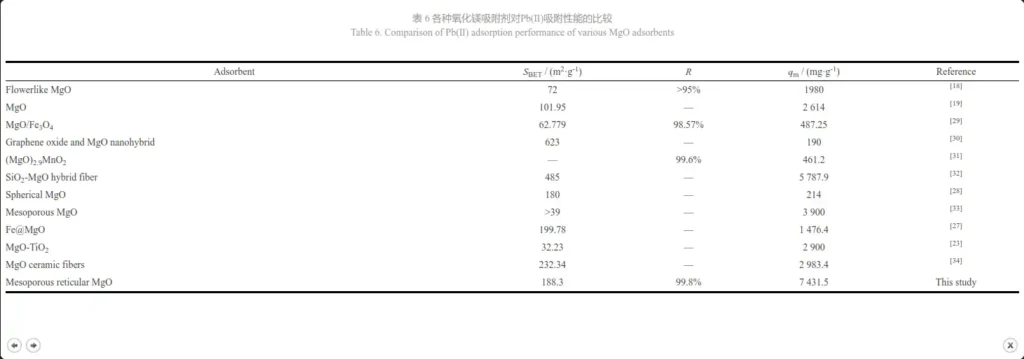
Figures 10a and 10b are obtained by fitting the Langmuir model and the Freundlich model based on the thermodynamic equation, and Table 5 shows their fitting parameters. Comparing the charts, it can be seen that the correlation R2=0.998 5 of the Langmuir model is much larger than the correlation R2=0.797 9 of the Freundlich model. Therefore, the adsorption process of magnesium oxide on Pb2+ is more consistent with the Langmuir model. The isotherm shows that the adsorption is a monolayer adsorption, and its binding sites have the same affinity for adsorption. The adsorption is uniform on the surface, which may be due to the chemical interaction between MgO nanoparticles and heavy metal ions [19]. The saturated adsorption capacity calculated by the Langmuir model is 7431.5 mg·g-1, which is much higher than the results reported in the literature (Table 6). The above results show that the prepared mesoporous MgO can be used as a fast and effective adsorbent for removing Pb(II) ions.
2.6 Adsorption mechanism of lead ions by magnesium oxide
Analysis of adsorption kinetics and adsorption isotherms showed that the adsorption mechanism may be due to the chemical interaction between MgO nanoparticles and heavy metal ions. In order to further study the removal mechanism of Pb(Ⅱ) by MgO, the concentration of Mg2+ in the solution was detected after each adsorption of different concentrations of Pb(Ⅱ) ions by magnesium oxide, and the relationship between the adsorption amount and the concentration of Mg2+ in the solution was analyzed, as shown in Figure 11a. It was observed that the concentration of Mg2+ in the solution increased with the increase of adsorption capacity (the Mg2+ concentration value is far less than 450 mg·L-1 stipulated by the World Health Organization, so it is safe to use this magnesium oxide adsorbent [18]). Mg2+ is part of the MgO lattice, which may be because Pb2+ replaces the position of Mg2+. Figure 11b shows the XRD pattern of the adsorbent after adsorption of Pb(Ⅱ) ions. From the position of the diffraction peaks, it can be judged that the products are mainly Pb3(CO3)2 (OH)2 (PDF No. 01-0687), PbO (PDF No. 72-0094), Mg(OH)2 and MgO. Mg(OH)2 is produced by hydration of MgO, and the generated Mg(OH)2 partially dissociates on the surface of MgO to form OH-. Therefore, Pb(Ⅱ) in the solution can combine with OH- to form Pb(OH)2. Since Pb(OH)2 is unstable, it can react with dissolved CO2 to form Pb3(CO3)2(OH)2. The presence of PbO can be attributed to the cation exchange between Mg2+ and Pb2+, which is actually a solid-liquid interface reaction. O2- can combine with metal ions to form metal oxides. The chemical reactions occurring during the adsorption process [19, 28] are as follows:
MgO+H2O→Mg(OH)2 (12)
3Pb2++Mg(OH)2+2CO2+2H2O→Pb3(CO3)2(OH)2+Mg2++4H+ (13)
MgO+Pb2+→PbO+Mg2+ (14)
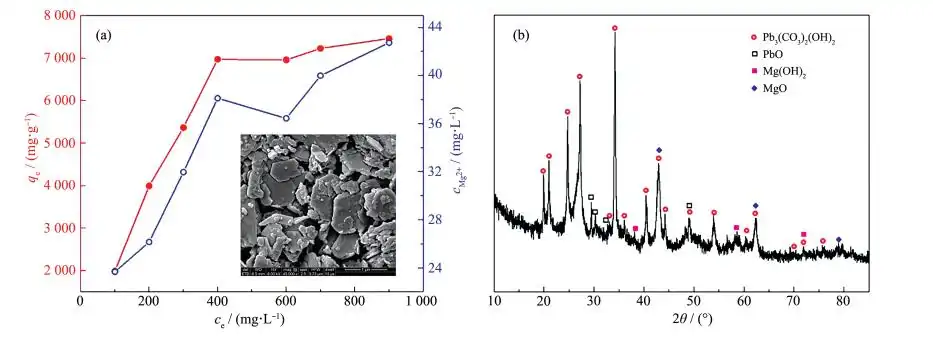
The SEM image of the product after Pb(Ⅱ) adsorption is shown in the inset of Figure 11a. The product morphology is a large plate-like structure. Obviously, the particle size of the product adsorbed with Pb(Ⅱ) is larger than that of the sample before adsorption, and the porous structure disappears, which can be attributed to the adsorption of heavy metal ions.
Therefore, the mechanism of Pb(Ⅱ) adsorption in water by MgO can be considered to be due to the ion exchange between the hydroxyl functional group and Mg(Ⅱ) and the heavy metal ions on the surface of MgO. The adsorption of Pb(Ⅱ) in water by MgO is chemical adsorption. After adsorption, new substances are formed, which causes the morphology of MgO to change, and therefore, it is difficult to regenerate.
2.7 Adsorption of other ions by magnesium oxide adsorbent
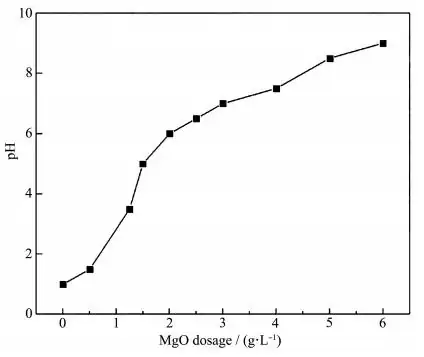
In order to study whether the magnesium oxide prepared in the experiment has good adsorption performance for other harmful ions, a multi-component adsorption experiment was carried out using a multi-ion mixed standard solution (pH=2). The changes in the amount of adsorbent and the pH after adsorption are shown in Figure 12. It can be seen that with the increase of the adsorbent, the pH of the solution increases, and the H+ competitive ability weakens, which is conducive to the adsorbent to exert good adsorption performance. As can be seen from Figure 13, the appropriate amount of adsorbent has excellent adsorption performance for Cd, Cr, Ni, As, Co, P, Se, Be, Bi, Cu, Fe, Mn, V, Zn, and Al, and the removal rate can reach more than 99%. Therefore, the high specific surface area mesoporous magnesium oxide has excellent adsorption performance for removing a variety of harmful ions, is an excellent water treatment agent, and has a high application value.

3. Conclusion
In summary, a mesoporous MgO with a high specific surface area of 188 m2·g-1, a high pore volume of 0.85 cm3·g-1 and an average pore size of 12.33 nm was prepared by a simple “calcination-hydration-calcination” method using naturally occurring and abundant hydromagnesite as raw material, and no reagent was added during the experiment. The product showed excellent water treatment performance. The experiment explored the effects of various factors on the adsorption performance, and the optimal experimental conditions were optimized: the adsorbent dosage was 0.05 g·L-1, the adsorption time was 45 min, the solution pH was 6~8, and the adsorption temperature was room temperature. Under these conditions, the removal rate of lead ions can reach more than 99.8%. The adsorption kinetics and isotherm data of the magnesium oxide adsorbent are highly consistent with the pseudo-second-order model and the Langmuir model, indicating that heavy metal ions are chemically adsorbed in a single layer on the magnesium oxide adsorbent, and the maximum adsorption amount is 7 431.5 mg·g-1, which is much higher than the values of other reported MgO-based adsorbents. We proposed an adsorption mechanism involving hydroxyl functional groups and ion exchange between Mg(II) and heavy metal ions on the surface of MgO. In addition, the magnesium oxide can adsorb multiple ions at the same time, and has excellent adsorption performance for Cd, Cr, Ni, As, Co, P, Se, Be, Bi, Cu, Fe, Mn, V, Zn, and Al ions. The above results show that the MgO adsorbent has the advantages of high efficiency, easy preparation, and easy promotion, is harmless to the environment, and is expected to become an excellent adsorbent for rapid removal of heavy metal ions in wastewater.
